Skip to content
  • MySensors
  • OpenHardware.io
  • Categories
  • Recent
  • Tags
  • Popular
Skins
  • Light
  • Brite
  • Cerulean
  • Cosmo
  • Flatly
  • Journal
  • Litera
  • Lumen
  • Lux
  • Materia
  • Minty
  • Morph
  • Pulse
  • Sandstone
  • Simplex
  • Sketchy
  • Spacelab
  • United
  • Yeti
  • Zephyr
  • Dark
  • Cyborg
  • Darkly
  • Quartz
  • Slate
  • Solar
  • Superhero
  • Vapor

  • Default (No Skin)
  • No Skin
Collapse
Brand Logo
Rodrigo PiedadeR

Rodrigo Piedade

@Rodrigo Piedade
About
Posts
2
Topics
1
Shares
0
Groups
0
Followers
0
Following
0

Posts

Recent Best Controversial

  • Possible mistake in the code of the exemple DustSensorDSM
    Rodrigo PiedadeR Rodrigo Piedade

    Corrections of the post:
    ratio= 1.1pow(concentrarion,3)-3.8pow(conccentration,2)+520*concentration+0.62
    the graph
    123.jpg

    Troubleshooting

  • Possible mistake in the code of the exemple DustSensorDSM
    Rodrigo PiedadeR Rodrigo Piedade

    The code shows that the concentration can be calculated by the expression:
    long concentration = 1.1pow(ratio,3)-3.8pow(ratio,2)+520ratio+0.62; // using spec sheet curve
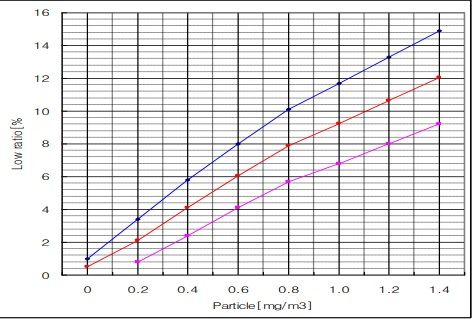
    But the sheet curve, as we can see in the graph, we have the concentration in the x axis, not in y as in the code:
    ratio= 1.1
    pow(ratio,3)-3.8pow(ratio,2)+520ratio+0.62
    I didn't understand why, in every code i see of this sensor, is the same. Can someone explain?
    If it is a dumb question, sorry, but help me please.
    The graph of data sheet.
    ![0_1607407293081_1da48a38-62da-4af6-a352-a1cbd79b2201-image.png](Uploading 100%)
    @epierre

    Troubleshooting
  • Login

  • Don't have an account? Register

  • Login or register to search.
  • First post
    Last post
0
  • MySensors
  • OpenHardware.io
  • Categories
  • Recent
  • Tags
  • Popular