MyController.org - 0.0.3-alpha1 released
-
Very nice work!!!!!!!!!
I found this controller yesterday ( used Openhab before),
downloaded it last night (before you released it a few hours later),
compiled it and it worked almost out of the box on my Raspberry Pi,...I am loving it already....
So easy to use with the mysensors,... only had to install the RF24 module on my raspberry pi and the Mycontroller hooked right into it,....Great work,... definitely will be using this and helping out where I can!!!
Wim
-
Hi!
Everything is working fine, but how can i add firmware files? In the Add firmware section i have no type and version. How can i add this?
Thanks
-
Hi!
Everything is working fine, but how can i add firmware files? In the Add firmware section i have no type and version. How can i add this?
Thanks
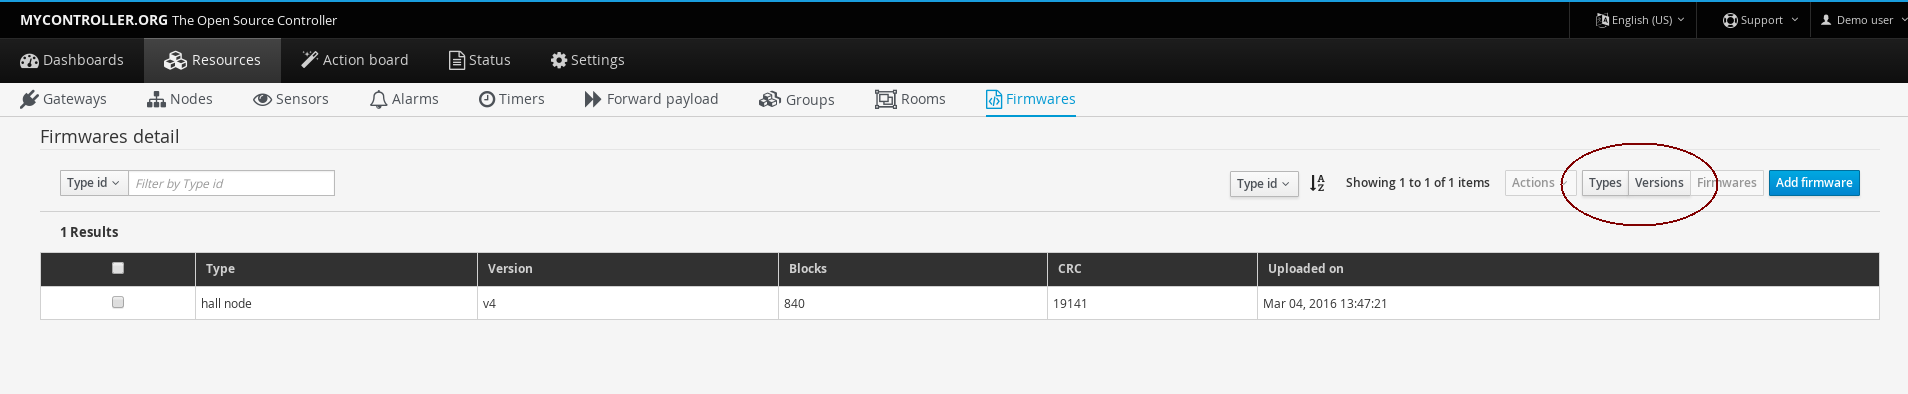
on firmware page click on
Typesto add new type
and click onVersionsto add new version. -
oooh really :stuck_out_tongue_winking_eye:
thanks :thumbsup:
-
Hello Jkandasa,
First, thank you very much for all the work you have put in your controller, it's a nice product and simple to have working.
I just have tried this last version, but I cannot get the dashboard to display a graph of sensor, like the details of the previous action board was doing.
To be more precise, I cannot get it to display a linear graph without having to wait for several minutes.I can see all the numerical values from my sensors, but on the linear graph I only have a rotating "please wait" circle.
They stay that way, I think, until (I think) every sensors have updated their values.
I say that, but it's a feeling, not a certainty.
The thing is, if the dashboard is displayed correctly, navigating to any other screen and getting back to the dashboard populates it again with the waiting symbols, for a few minutes.Is this something known?
@tripy Thank you for using MyController.org
No, It is not a known issue. I need some details to understand more,
- Is your sensor has data(linear graph)?
- What type of sensor and variable type?
- Did you upgrade MyController.org from 0.0.3-alpha1-SNAPSHOT version?
- Can you send the details of following? Open your MyController dashboard page in chrome browser, press
CTRL+SHIFT+I, Once chrome developer screen opened, navigate toNetworkswait few seconds(based on refresh time for graph, default: 30 seconds). You will see request something likehttps://host-ip:8443/mc/rest/metrics/metricsData?timestampFrom=1457120861793&variableId=1&withMinMax=false. Click that and navigate toResponse. Can you post that data?
Thank you!
-
@tripy Thank you for using MyController.org
No, It is not a known issue. I need some details to understand more,
- Is your sensor has data(linear graph)?
- What type of sensor and variable type?
- Did you upgrade MyController.org from 0.0.3-alpha1-SNAPSHOT version?
- Can you send the details of following? Open your MyController dashboard page in chrome browser, press
CTRL+SHIFT+I, Once chrome developer screen opened, navigate toNetworkswait few seconds(based on refresh time for graph, default: 30 seconds). You will see request something likehttps://host-ip:8443/mc/rest/metrics/metricsData?timestampFrom=1457120861793&variableId=1&withMinMax=false. Click that and navigate toResponse. Can you post that data?
Thank you!
@jkandasa In order:
- Yes, they are linear
- 3 nodes. 2 nodes have 3 sensors (humidity, temperature and luminosity). 1 node just have humidity and temperature.
They implement respectively V_HUM, V_TEMP and V_LIGHT_LEVEL
They all basically are the DHT sensor, and I've added a LDR to report a relative luminosity in rooms. - I didn't upgraded. I run the 0.2 version on 1 machine, and have tried on another the 0.3
I downloaded the 0.3 that is available on the site. The file name is mycontroller-standalone-0.0.3-alpha1-bundle.tar.gz
So no, it's not the snapshot and it was a clean install.
They both use a MQTT broquer to get data (Latest version of mosquitto).
I did not use the built in MQTT broker from the 0.3 version - I'm running on Linux, and usually run Firefox. I tried to access mycontroller with Chromium with the same results.
This is the dashboard initially:
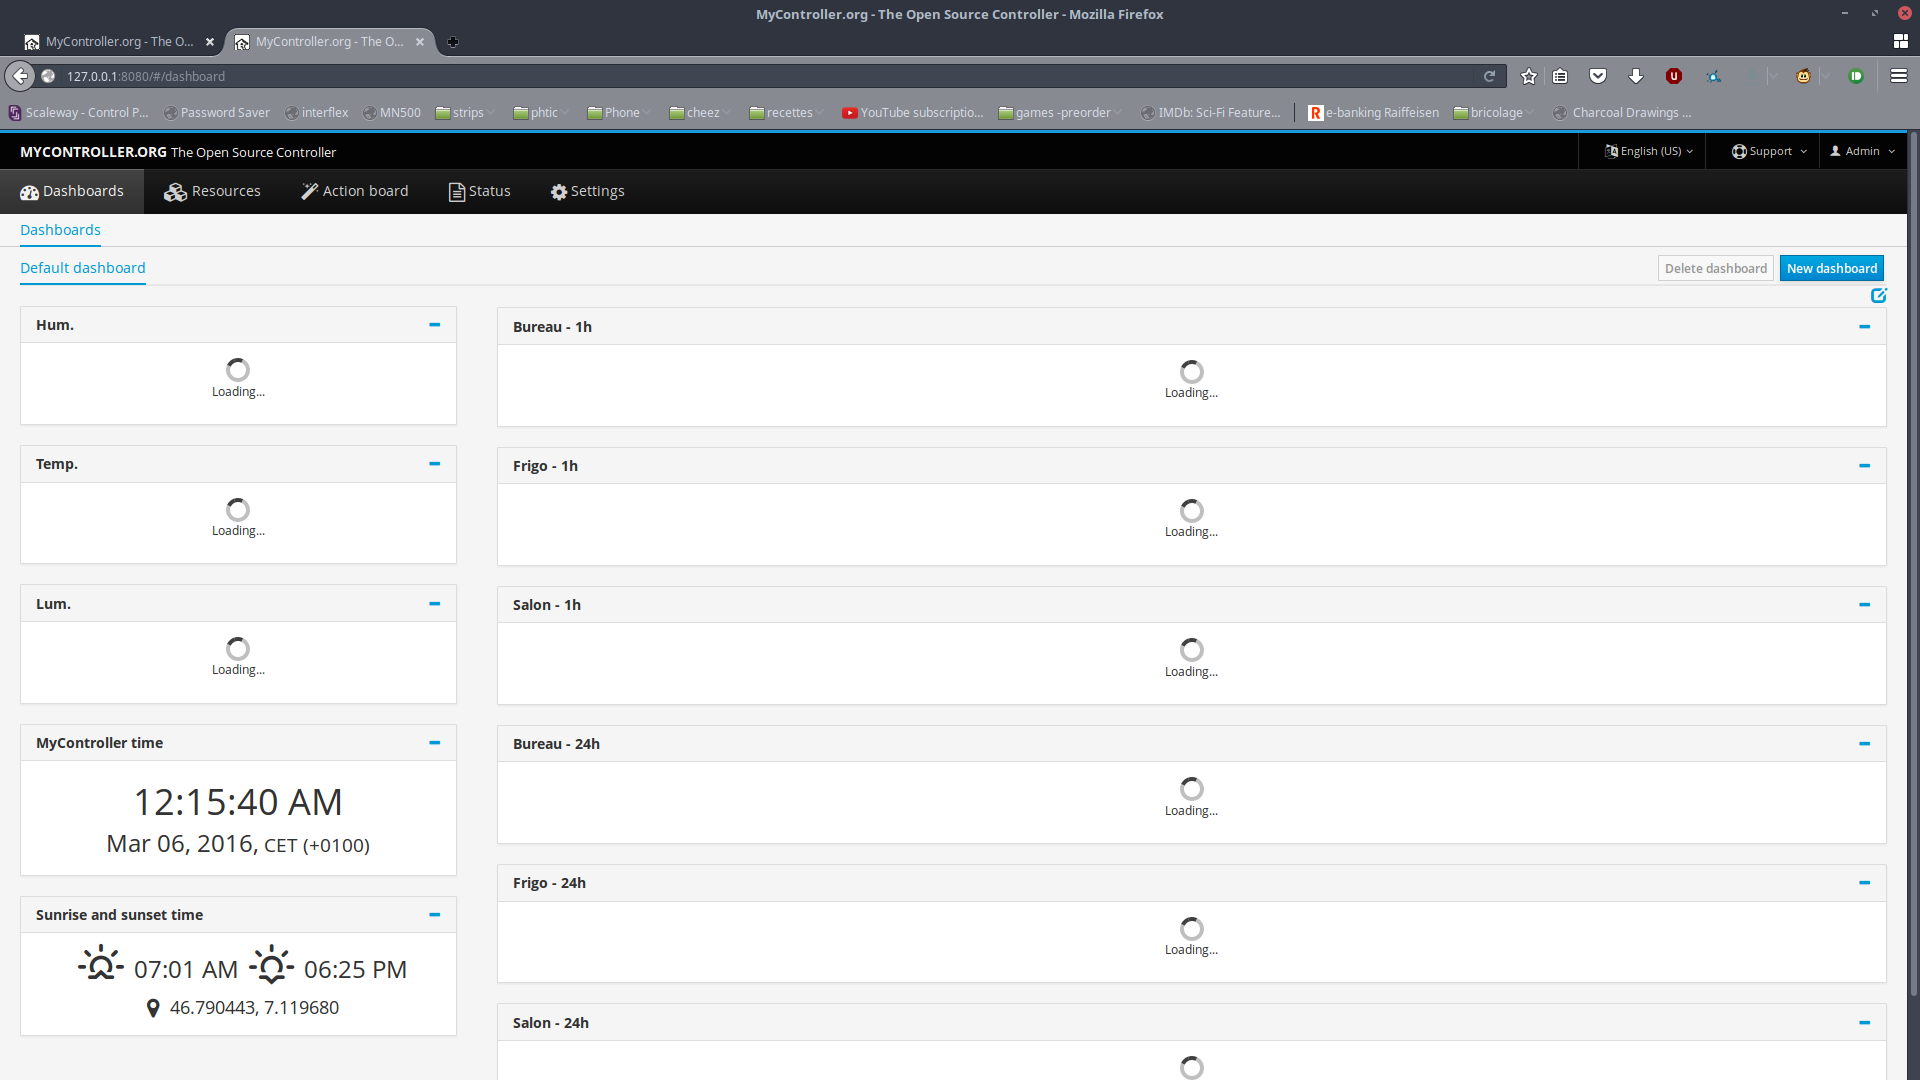
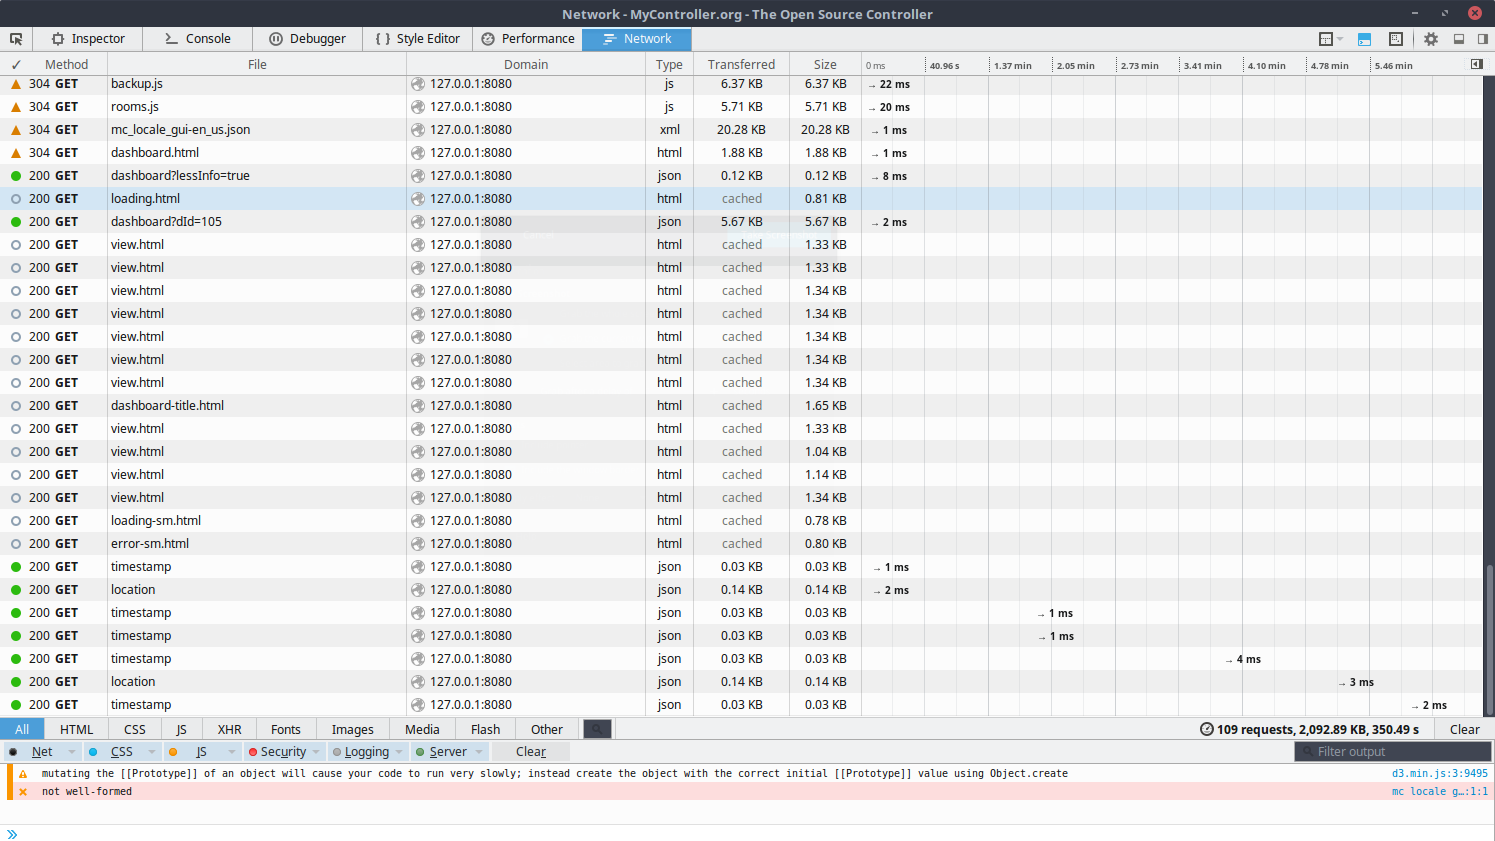
The strange thing is that I don't see a "metricsData" request in the initial display of the page.
All the bootstrapping happens in a few ms, and then nothing for the next 6 minutes.
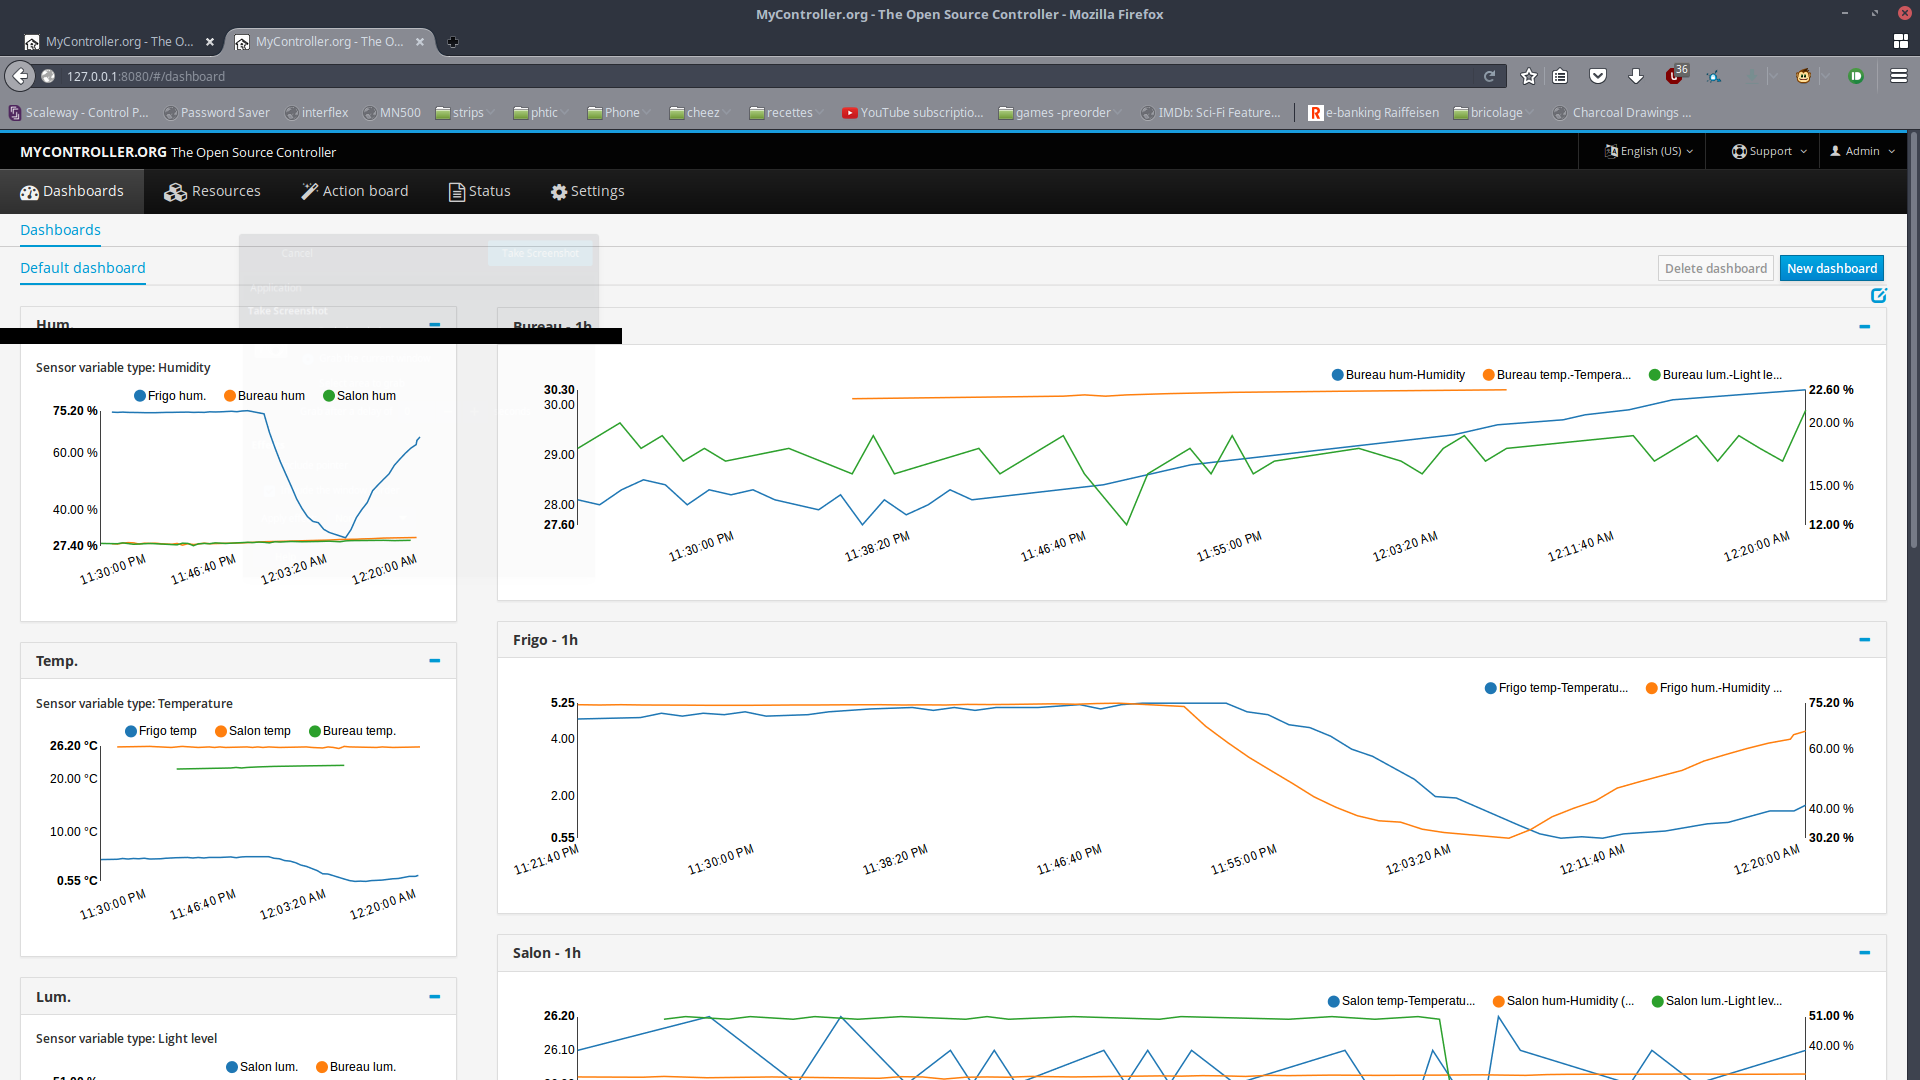
And then, suddenly at the 7th minute, several metricsData request are coming through:
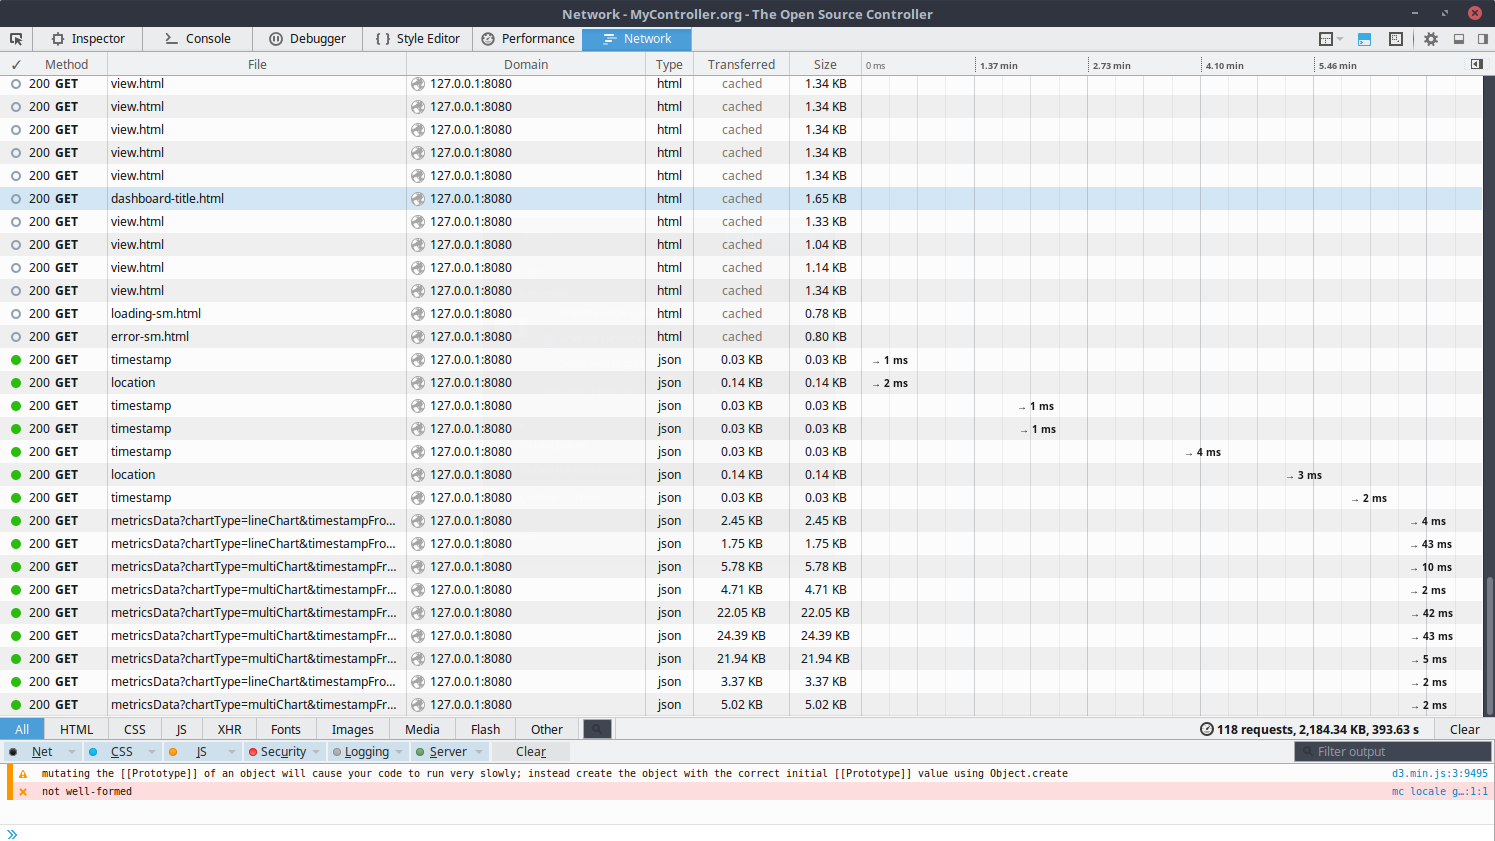
My dashboard is then ok, until I reload the page or naviate to another screen.
Hoping that this is relevant to you:
Java version:openjdk version "1.8.0_72-internal" OpenJDK Runtime Environment (build 1.8.0_72-internal-b15) OpenJDK 64-Bit Server VM (build 25.72-b15, mixed mode)I tried to run it on a similar system (the one running the 0.2 version) with the same symptoms.
I hope it's enough data to help you.
Thanks. -
Hi,
Ich like the mycontroller very much, the GUI is easy to use and work fine.
One question: Is there a way to make an virtuell sensor with to crom Temperature aalculate the dewpoint fnd humidity with a formular.
Or is it easiar to implement it in the Sensor.Thanks
Michael -
Hi,
Ich like the mycontroller very much, the GUI is easy to use and work fine.
One question: Is there a way to make an virtuell sensor with to crom Temperature aalculate the dewpoint fnd humidity with a formular.
Or is it easiar to implement it in the Sensor.Thanks
Michael@midopple Thank you for your interest with MyController.org. For now we do not have any option to implement formula with MyController.org.
But in future we should the one.
-
Ok, I feel pretty dumb not to have thought of it before, but I've found the issue.
For the sake of anyone running in the same issue, if you are running an ad blocker, try to disable it first.
Looking at the request in Chromium, it said "ERR_BLOCKED_BY_CLIENT"
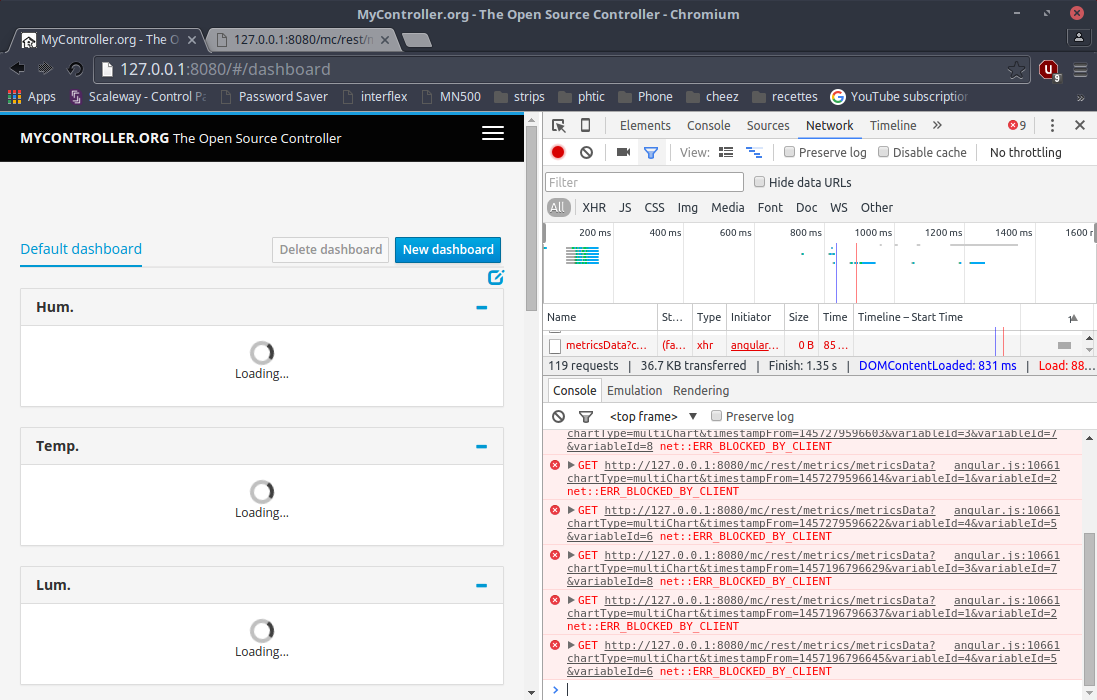
Turning off the ad blocker resulted in a dashboard as you would expect it.Sorry for bothering you for something I should have thought of, and thank you for your support.
Hello! It looks like you're interested in this conversation, but you don't have an account yet.
Getting fed up of having to scroll through the same posts each visit? When you register for an account, you'll always come back to exactly where you were before, and choose to be notified of new replies (either via email, or push notification). You'll also be able to save bookmarks and upvote posts to show your appreciation to other community members.
With your input, this post could be even better 💗
Register Login