Air Quality Sensor
-
Hello,
sadly the discussions were lost...
So let's start again on the subject:
https://github.com/empierre/arduino
Here is the list of my current experimentations:
-
MQ135.ino : for CO2/COV ... validated - MQ2.ino : for ethanol... needs pre-heat : ongoing
- MQ6 sensor : just received
- MQ131 sensor : just received
- TGS2600 sensor : just received
I'm getting serious a with a mega and a sensor board, 4 of them are connected together !
The MQ135 is not on the list, I use it to measure CO2 in children's room...
Values:- MQ2: 85 - Combustible gas and smoke
- MQ6: 25 - Isobutane, Butane, LPG
- MQ131: 57 - O3, CL2
- TGS2600: 943 - ethanol, hydrogen, iso-butane, CO, Methane
As discussed before, I would appreciate someone helping me reading the logarithmic curves in the datasheet (link on each sensor name above) to get the linear value based on analog reading. I need to learn reading it... thanks!
as an example here in sandboxelectronics we saw that several values could be read from the datasheet:
float LPGCurve[3] = {2.3,0.21,-0.47}; //two points are taken from the curve. //with these two points, a line is formed which is "approximately equivalent" //to the original curve. //data format:{ x, y, slope}; point1: (lg200, 0.21), point2: (lg10000, -0.59) float COCurve[3] = {2.3,0.72,-0.34}; //two points are taken from the curve. //with these two points, a line is formed which is "approximately equivalent" //to the original curve. //data format:{ x, y, slope}; point1: (lg200, 0.72), point2: (lg10000, 0.15) float SmokeCurve[3] ={2.3,0.53,-0.44}; //two points are taken from the curve. //with these two points, a line is formed which is "approximately equivalent" //to the original curve. //data format:{ x, y, slope}; point1: (lg200, 0.53), point2: (lg10000, -0.22) float Ro = 10; //Ro is initialized to 10 kilo ohms@epierre you say you need some help reading the logarithmic curves, right?
I copied one curve from the MQ2 datasheet :
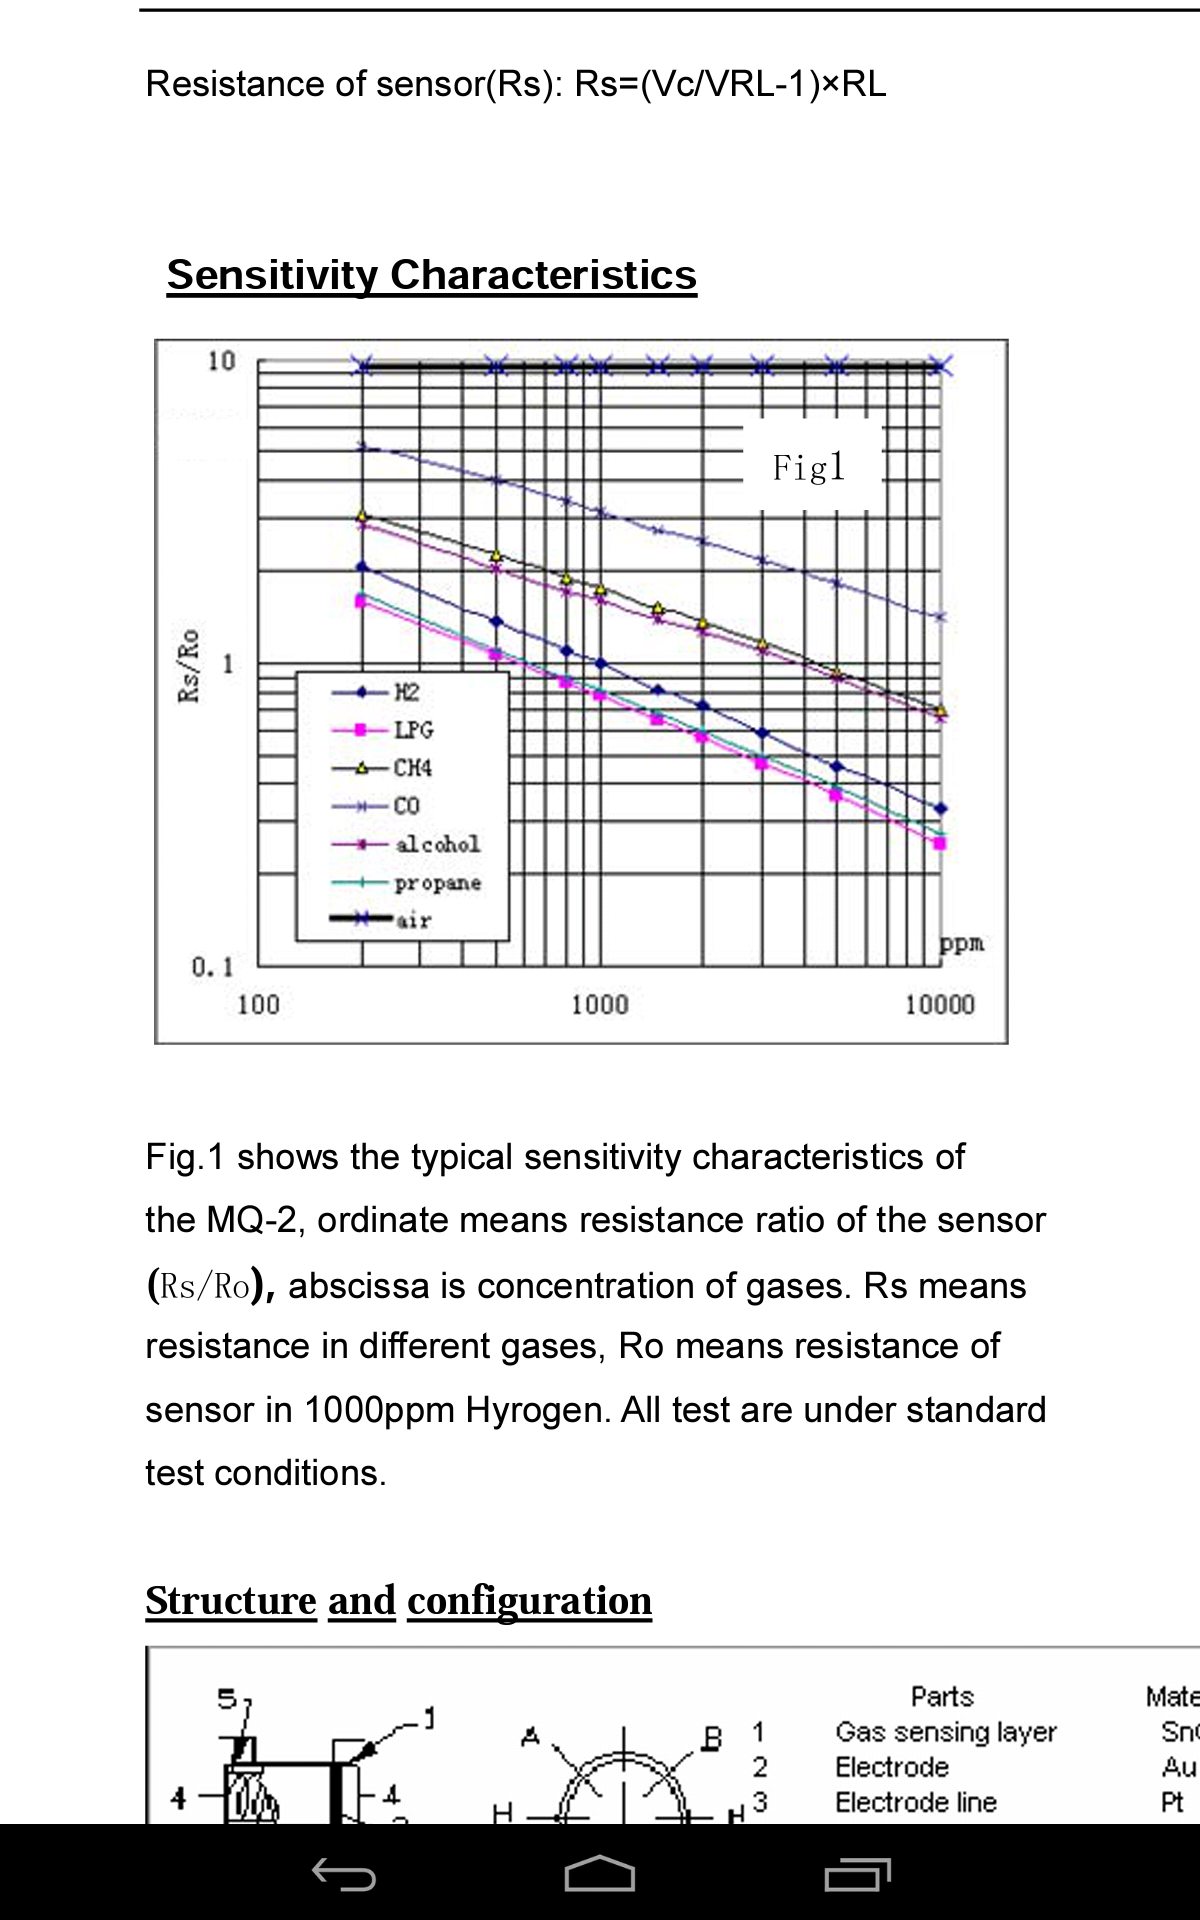
Along the horizontal axis you see the values 100, 1000 & 10000.
Between 100 & 1000 each vertical line adds 100, between 1000 & 10000 each vertical line adds 1000.
On the vertical axis it works just the same: each horizontal line between 0.1 & 1 adds 0.1, between 1 & 10 it adds 1.
So the first H2 lies at (200,2)http://yveaux.blogspot.nl
-
-
@epierre you say you need some help reading the logarithmic curves, right?
I copied one curve from the MQ2 datasheet :
Along the horizontal axis you see the values 100, 1000 & 10000.
Between 100 & 1000 each vertical line adds 100, between 1000 & 10000 each vertical line adds 1000.
On the vertical axis it works just the same: each horizontal line between 0.1 & 1 adds 0.1, between 1 & 10 it adds 1.
So the first H2 lies at (200,2)@Yveaux Thanks, but can you confirm the measure that I quoted above, for I don't find them... (LLPG, CO, what they call smoke ???)
@marceltrapman thanks for the hint... I spent some time trying to find it... I'm more a wikiforumman
-
@Yveaux Thanks, but can you confirm the measure that I quoted above, for I don't find them... (LLPG, CO, what they call smoke ???)
@marceltrapman thanks for the hint... I spent some time trying to find it... I'm more a wikiforumman
Ok mesurement understood...
values must be in logarithmic... sometime they display lg for log, or directly the log calculated value which does not help understand it...
so for the slope from the values read : (LOG(0,4)-LOG(1))/(LOG(10000)-LOG(1000)) and I agree to the curves.
Now let's go to the next point: resistive protection.
My boards (to few exception) are this : http://img.dxcdn.com/productimages/sku_193001_4.jpgThere are 1K and 10K resistors, plus a variable one.
From the article I base myself, it says:
The protection resistor (4.7Kohms) and the adjustable (0-50Kohms) are in serial which forms a load resistor RL (4.7-54.7Kohms). The sensor’s resistance RS and RL forms a voltage divider. The output voltage on the signal pin could be read by Arduino or MCU via ADC. Given a value of RL , Power Supply Voltage, and output voltage, RS could be derived. Based on the chart provided in the MQ-2 datasheet, RS in clean air under given temperature and humidity is a constant,which is the “initial” resistance of the sensor named RO. RO of the resistor could be derived from RS.I guess it is a different board here, so values must differ. Have you an idea how to mesure this with my multimeter ? else each time the sensor would start, the value would be calculated, clean or not :
The main job of the calibration is to calculate the RO by sampling and averaging the readings when the module is placed in the clean air. Once the RO is derived, the concentration of target gas could be calculated by using the RS/RO ratio as the input. To achieve more accuracy, a segmented look-up table should be used. However, in the demonstration, a linear formula is used as an approximation to the original curve. -
So tonight with these new formulae, I updated my mega sketch to get :
 MQ2    :LPG   :0ppm    CO    :0ppm    SMOKE :0ppm
 MQ6    :LPG   :0ppm    CH4   :0ppm
 MQ131  :CL2   :1ppm    O3    :1ppm
 TGS2600:H2    :0ppm    C2H5OH:0ppm    C4H10 :0ppm
Going through the "clean air calibation" I have:
float MQResistanceCalculation(int raw_adc)    {
  return ( ((float)RL_VALUE*(1023-raw_adc)/raw_adc));
}
Here are the readings without:
MQ2:5.28
MQ6:36.94
MQ131:3.61
TGS2600:0.04
and with all is 0... BTW...
What do you think of that ? nothing indicated that MQ6 should be so big, and tgs so low... same for MQ131 that should be 100k-200k per datasheet....
-
So tonight with these new formulae, I updated my mega sketch to get :
 MQ2    :LPG   :0ppm    CO    :0ppm    SMOKE :0ppm
 MQ6    :LPG   :0ppm    CH4   :0ppm
 MQ131  :CL2   :1ppm    O3    :1ppm
 TGS2600:H2    :0ppm    C2H5OH:0ppm    C4H10 :0ppm
Going through the "clean air calibation" I have:
float MQResistanceCalculation(int raw_adc)    {
  return ( ((float)RL_VALUE*(1023-raw_adc)/raw_adc));
}
Here are the readings without:
MQ2:5.28
MQ6:36.94
MQ131:3.61
TGS2600:0.04
and with all is 0... BTW...
What do you think of that ? nothing indicated that MQ6 should be so big, and tgs so low... same for MQ131 that should be 100k-200k per datasheet....
@epierre are you totally sure of the calculation in MQResistanceCalculation? Maybe the evaluation is correct, but I always add some braces to make the evaluation order explicit: first do the substraction, then the float multiplication and the integer division, cast to float, as last.
http://yveaux.blogspot.nl
-
@epierre are you totally sure of the calculation in MQResistanceCalculation? Maybe the evaluation is correct, but I always add some braces to make the evaluation order explicit: first do the substraction, then the float multiplication and the integer division, cast to float, as last.
@Yveaux you mean something like this ?
return ( (((float)RL_VALUE*(1023.0 - (float) raw_adc)) / (float) raw_adc));I somehow forked the discussion on arduino.cc and sent an email in parallel do Davide Gironi for I would like to understand his formula as opposed to the curve approach.
-
@epierre something like that, yes. You could also feed it some artificial values in a debug build and see if the calculated values match your expectations.
It wouldn't be the first time that some calculations (divisions) are unexpectedly calculated as ints and always return either 0 or 1 instead of the expected fraction... -
Hello,
Having sorted out how to make a power regression, I now have the sames values as Davide Gironi.
I applied this to MQ2, MQ6, MQ131, MQ135 and TGS2600 with resistance calibration at start.
MQ2    :LPG   :12ppm    CO    :0ppm    SMOKE :21ppm
MQ6    :LPG   :3ppm    CH4   :39ppm
MQ131  :CL2   :2ppm    O3    :3ppm
TGS2600:H2    :5191ppm    C2H5OH:8825ppm    C4H10 :16954ppm
MQ135  :CO2    :0ppm    CO    :0ppm    CH3    :0ppm    NH4    :0ppm
GP2Y1010AU0F Raw Signal Value (0-1023): 19 - Voltage: 0.09 - Dust Density: -84.23
the MQ135 is still doing its first heating period, do not care about its values.
Clearly the TGS shows abnormal values, I'm quite puzzled by this, using the previous method it was always 0...
-
Hello,
Having sorted out how to make a power regression, I now have the sames values as Davide Gironi.
I applied this to MQ2, MQ6, MQ131, MQ135 and TGS2600 with resistance calibration at start.
MQ2    :LPG   :12ppm    CO    :0ppm    SMOKE :21ppm
MQ6    :LPG   :3ppm    CH4   :39ppm
MQ131  :CL2   :2ppm    O3    :3ppm
TGS2600:H2    :5191ppm    C2H5OH:8825ppm    C4H10 :16954ppm
MQ135  :CO2    :0ppm    CO    :0ppm    CH3    :0ppm    NH4    :0ppm
GP2Y1010AU0F Raw Signal Value (0-1023): 19 - Voltage: 0.09 - Dust Density: -84.23
the MQ135 is still doing its first heating period, do not care about its values.
Clearly the TGS shows abnormal values, I'm quite puzzled by this, using the previous method it was always 0...
@epierre I'm still a bit wondered by the way in which you present the values.
I, for instance, have an MQ135. Is "sensitive to noxious gas concentration. MQ135 sensor also sensitive to sulfide, benzene steam, smoke, etc". The logarithmic charts in the datasheet show the sensitivity to the various gases.
This sensor has a single analog output from which IMHO you cannot determine the fraction of individual gases. Yet you present them as individual values in your measurement data... How can you distinguish?http://yveaux.blogspot.nl
-
@epierre I'm still a bit wondered by the way in which you present the values.
I, for instance, have an MQ135. Is "sensitive to noxious gas concentration. MQ135 sensor also sensitive to sulfide, benzene steam, smoke, etc". The logarithmic charts in the datasheet show the sensitivity to the various gases.
This sensor has a single analog output from which IMHO you cannot determine the fraction of individual gases. Yet you present them as individual values in your measurement data... How can you distinguish? -
@Yveaux in fact it is a correlation, if you have a value from the analog, then from the curve you can guess it is one of the group, not one individually... it is the way they are designed...
-
@Yveaux and there's worse : if you don't have the environment to calibrate it with real gas, it is just an indication... that is maybe why some projects that may have taken such sensor may hae a production process issue at the moment... In fact despite my researches, I've never found someone that said it made it to mesure correctly with gas sensors, mostly theory or just analog reading only...
An example: my MQ135 was silencious, I put its nose in the Aceton bottle:
Before:
Q2 :LPG :11ppm CO :0ppm SMOKE :18ppm
MQ6 :LPG :3ppm CH4 :36ppm
MQ131 :CL2 :2ppm O3 :3ppm
TGS2600:H2 :7602ppm C2H5OH:13706ppm C4H10 :26350ppm
MQ135 :CO2 :0ppm CO :0ppm CH3 :0ppm NH4 :0ppm
Dust :raw : 18 Voltage: 0.09 - Dust Density: -85.06After:
MQ2 :LPG :208ppm CO :0ppm SMOKE :832ppm
MQ6 :LPG :44ppm CH4 :172ppm
MQ131 :CL2 :16ppm O3 :17ppm
TGS2600:H2 :7774ppm C2H5OH:13818ppm C4H10 :27274ppm
MQ135 :CO2 :999ppm CO :0ppm CH3 :484ppm NH4 :1904ppm
Dust :raw : 58 Voltage: 0.28 - Dust Density: -51.86The MQ135 has reacted, but all others around...
doing the same on my basic sketch here what I have:
2014-08-03 11:29:57 3 0 1 24 -28393looks like my old sketch needs some update...
-
Doing the same on the basic sketch :
 Vrl / Rs / ratio:4.21 3731.17 0
 CO ppm :inf
Then:
Vrl / Rs / ratio:4.21 3731.17 0 CO ppm :inf -
and now ethanol/isopropylène (bike chain cleaning product):
MQ2 :LPG :247ppm CO :0ppm SMOKE :1053ppm MQ6 :LPG :3527ppm CH4 :2160ppm MQ131 :CL2 :10ppm O3 :12ppm TGS2600:H2 :7891ppm C2H5OH:14279ppm C4H10 :27751ppm MQ135 :CO2 :0ppm CO :0ppm CH3 :0ppm NH4 :0ppm Dust :raw : 206 Voltage: 1.01 - Dust Density: 71.00 -
and now eveyone through aceton:
MQ2    :LPG   :25ppm   CO    :0ppm    SMOKE :48ppm
MQ6    :LPG   :19677ppm    CH4   :3010ppm
MQ131  :CL2   :71ppm    O3    :51ppm
TGS2600:H2    :8448ppm C2H5OH:15007ppm C4H10 :28738ppm
MQ135  :CO2   :840ppm    CO    :0ppm     CH3   :400ppm    NH4    :1474ppm
Dust   :raw   : 728    Voltage: 3.55 - Dust Density: 504.30
remark that dust sensor goes up ! and TGS2600 goes down afterward:
MQ2 :LPG :8ppm CO :0ppm SMOKE :11ppm MQ6 :LPG :1264ppm CH4 :1194ppm MQ131 :CL2 :27ppm O3 :24ppm TGS2600:H2 :4966ppm C2H5OH:8407ppm C4H10 :16227ppm MQ135 :CO2 :840ppm CO :0ppm CH3 :400ppm NH4 :1474ppm Dust :raw : 165 Voltage: 0.81 - Dust Density: 36.96 -
@hek I now have the netatmo CO2 xml and json, they are based on the generic sensor.
But I don't have mysensors running on my vera...
I would need from you:
- the device and variable type
- an icon, but maybe I can reuse the other one
maybe
CO2 = {22, "urn:schemas-micasaverde-com:device:CO2Sensor:1", "D_CO2Sensor.xml", "CO2 "}
CO2 = {36, "urn:micasaverde-com:serviceId:CO2Sensor", "Concentration", "396" },S_CO2Sensor.json D_CO2Sensor.xml D_CO2Sensor.json
P.S. there's the icon from Nest plugin too: http://cocu.la/vera/nest/nest_co.png
-
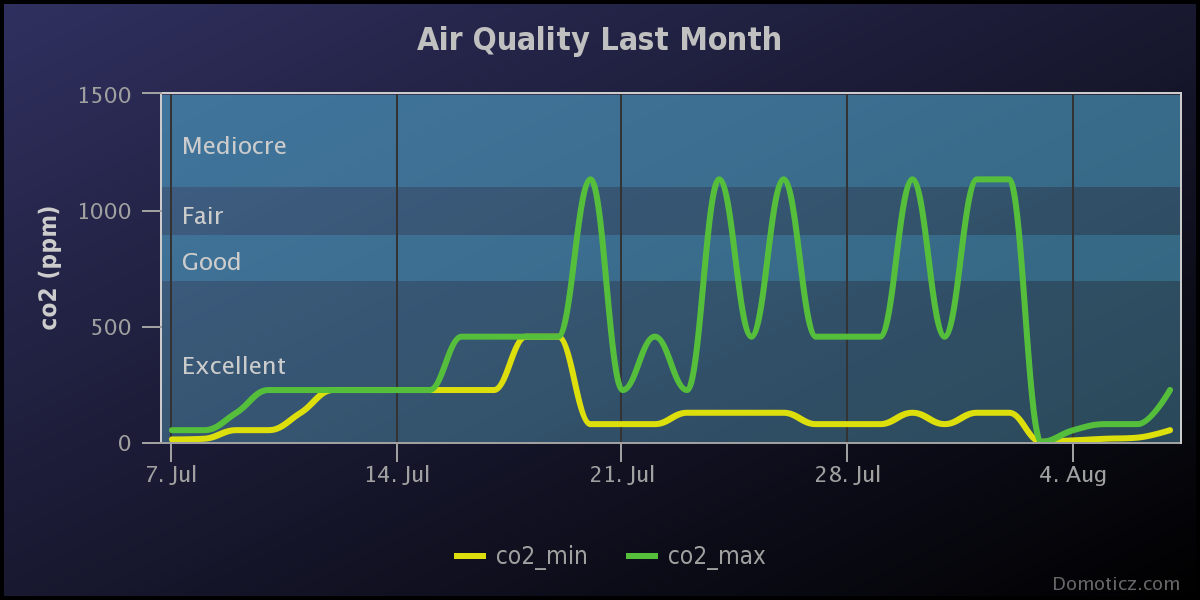
About initial calibration, just a warning from this graph:
you can see high levels around july 21 then dropping in august... the sensor has been restarted... that is what the call clean air...
this automatic reading at the start should be stored in the sketch and not reclaculated at each reboot or you would loose all reference on your data...