Graphing of time measured events - Solved
-
You could set up an influxdb server and have domoticz send updates to it. I do that for some things that I want to track for more than a year. Then you can use grafana to set up graphs you like. Domoticz has a setting you can use to pick readings to send to influxdb.
-
You could set up an influxdb server and have domoticz send updates to it. I do that for some things that I want to track for more than a year. Then you can use grafana to set up graphs you like. Domoticz has a setting you can use to pick readings to send to influxdb.
@nagelc True, but this is more a question of what format should be used to natively record it in Domoticz.
The binary V_STATUS and S_HEATER works ok, but V_VOLUME and S_GAS was used simply as a temporary solution. The Gas Meter already reports in this format, so knew it summated hourly and graphed natively. I know that the displayed 82.000m3 really means 82 minutes burn time, but it's not neat.I have to look into infuxdb later to combine and analyse different datasets, but for now I'm hoping someone can point me to what I'm obviously not seeing in the documentation.
-
@skywatch Thanks but no need, the temp side has more or less worked flawlessly with 12 DS18B20 on a single Cat5e for over 2 years now, quite intriguing to see temp variations over two years...
The next pair is for this Node, the same as you did for flow return temps, once the order arrives. Having put Heimeier constant flow thermo valves on the radiators last year I managed to draw the return temp right down from roasting to warm at peak, but it would be good to quantify. It lopped 10% off the gas so that tweak already paid for itself, and kept the place +/- 0.5 degrees... ;)The graphing question is more a case of recording boiler burn times as an integer for the CH such that daily minute durations are built and retained up to say a year. Currently I send a binary to a "Switch" and a cumulative read as "Gas". The former has a glitch and limited time retained, the latter is a temporary solution to display a bar graph, and build/retain a daily record for up to a year.
It's not ideal, and as the same Node will also soon begin recording power cuts, a better solution is doubtless available to MySensors/Domoticz, I just can't find it... -
@zboblamont Have you looked at grafana.com?
@skywatch I haven't looked at anything external yet, haven't even gotten round to trying out NodeRed... :cry:
-
@nagelc True, but this is more a question of what format should be used to natively record it in Domoticz.
The binary V_STATUS and S_HEATER works ok, but V_VOLUME and S_GAS was used simply as a temporary solution. The Gas Meter already reports in this format, so knew it summated hourly and graphed natively. I know that the displayed 82.000m3 really means 82 minutes burn time, but it's not neat.I have to look into infuxdb later to combine and analyse different datasets, but for now I'm hoping someone can point me to what I'm obviously not seeing in the documentation.
@zboblamont
Yeah .... I see the problem. I have several sensors that measure levels that I report as voltage, because I just want to send a float number, and S_Voltage handles that. A nice feature would be to be able to override the units display, but I haven't figured out how to do that. -
@zboblamont
Yeah .... I see the problem. I have several sensors that measure levels that I report as voltage, because I just want to send a float number, and S_Voltage handles that. A nice feature would be to be able to override the units display, but I haven't figured out how to do that.@nagelc It appears after further reading and research that it is neither a possibility nor on Domoticz's radar to handle time dependant events.
I found an excellent discussion and working LUA strategies using Dummy sensors which satisfied those who had used it to solve pump run-time queries, but it disintegrated upon arrival of a much earlier version of Domoticz than today.
I must presume that because time is perceived as a datum against which Domoticz contrasts events, time duration such as "pump running" is not on their agenda and is well off-field for future consideration..
Going to investigate LUAs, already dimly acquainted with the LUAS... -
Domoticz has a nice dummy counter or dummy incremental counter, where you can enter the unit quantity.
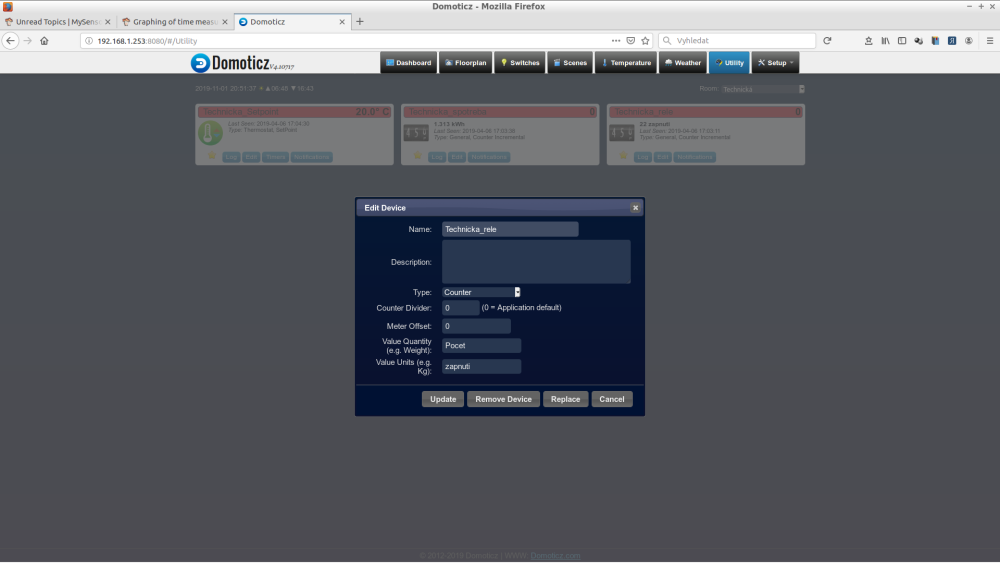
MySensors unfortunately is unable to send data to these counters.
I am using them with ESP8266 to send energy consumption of my floor heating or number of actions of my relays.
So I recommend to use DzVents scripts in Domoticz instead of node-red.
I see two ways.
1.
Send from node for example in watts or m3 or litters.
With DzVents translate this value to time in minutes in Domoticz created dummy counter.Write DzVents script for your switch, which saves time for ON action and when OFF action occurs, calculate time interval and adds minutes to dummy counter.
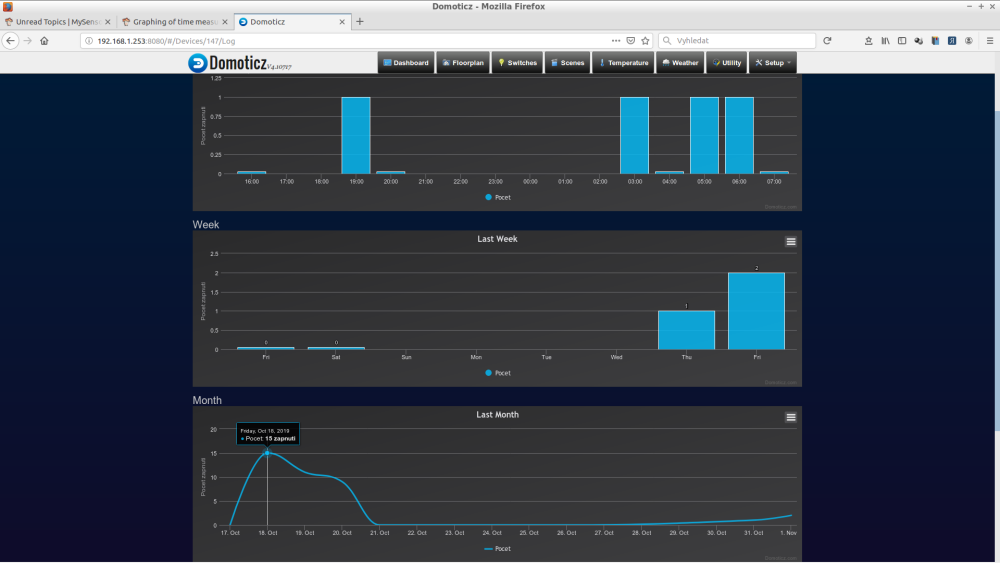
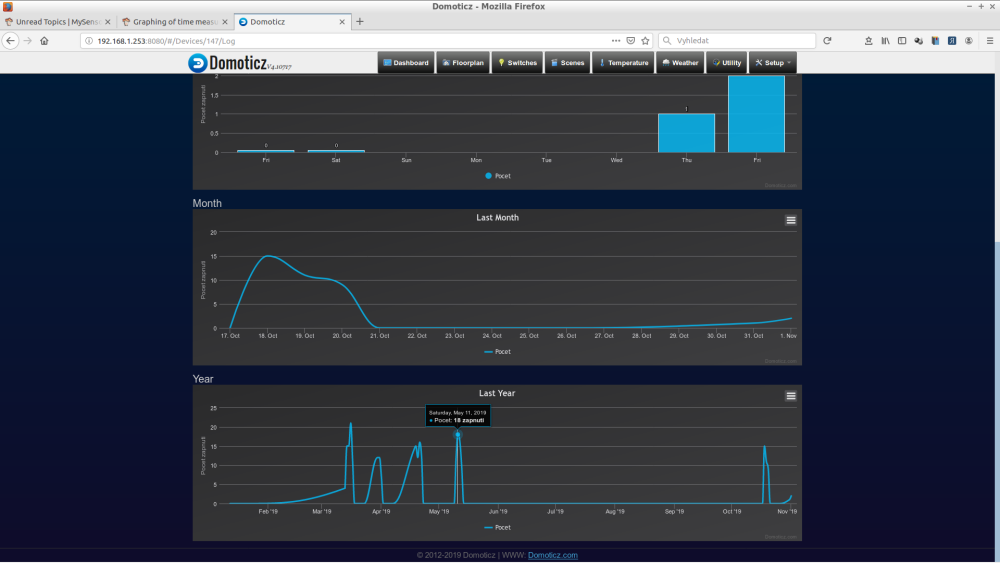
Then you can see the beautiful statistics for each day of the entire year back and the actual total value too.
For example here for my relay actions:
( "zapnuti" = "relay on" )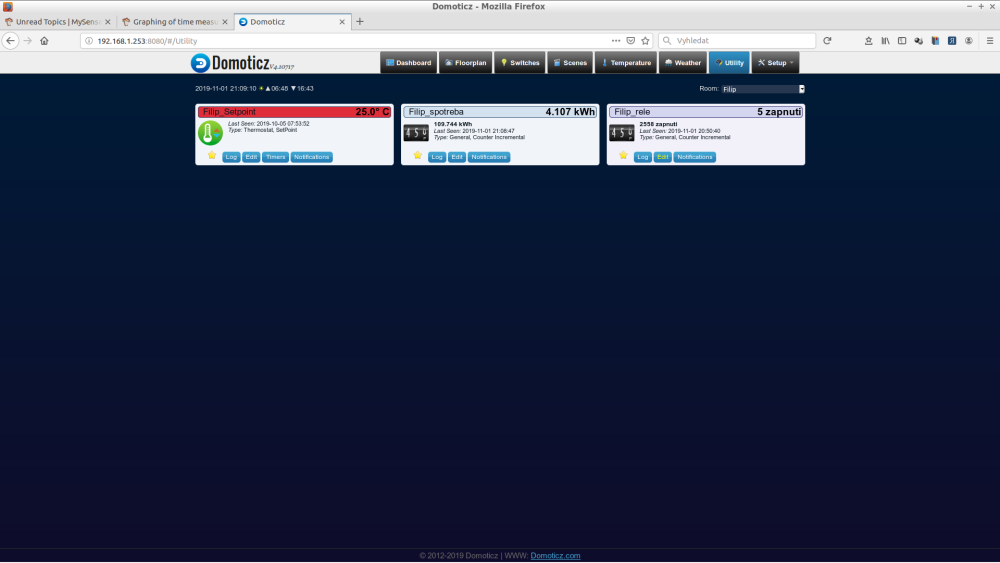
-
Domoticz has a nice dummy counter or dummy incremental counter, where you can enter the unit quantity.
MySensors unfortunately is unable to send data to these counters.
I am using them with ESP8266 to send energy consumption of my floor heating or number of actions of my relays.
So I recommend to use DzVents scripts in Domoticz instead of node-red.
I see two ways.
1.
Send from node for example in watts or m3 or litters.
With DzVents translate this value to time in minutes in Domoticz created dummy counter.Write DzVents script for your switch, which saves time for ON action and when OFF action occurs, calculate time interval and adds minutes to dummy counter.
Then you can see the beautiful statistics for each day of the entire year back and the actual total value too.
For example here for my relay actions:
( "zapnuti" = "relay on" )@kimot Thank you very much indeed.
Was already looking at such a strategy but your explanation confirms it is not only viable but you already have a working solution as extensively exampled.
It is an odd omission by the Domoticz team that it requires a workaround, but your solution is neatly done. -
Having gone through various hoops and headaches the objective is finally solved but by a method I'd not considered, that being to switch from the Node doing the work to Domoticz executing it internally.
The objective had been to record boiler run times and record the boiler feed and return temperatures. The latter hit a problem (unsolved) over the Dallas Library, but after some pointers from @ scalz, it was cracked using the Onewire library in isolation.The psu and the boiler states are reported as logical switches, the cumulative run time in kWh as @kimot had suggested.
Unfortunately, as the Node is mains powered with a battery backup, it will continue monitoring in a power outage, but on restoration of power, the Node reboots and sets the cumulative running time back to what was defined in the sketch.
Couldn't get the V_VAR retrieval method from Domoticz (UPS powered) to work (my lack of understanding), but stumbled across a post on the Domoticz forum (a Niels someone?) who used scripts to record duration in minutes for the ON state of the logical switch to a Custom Sensor, and resets that value at midnight.
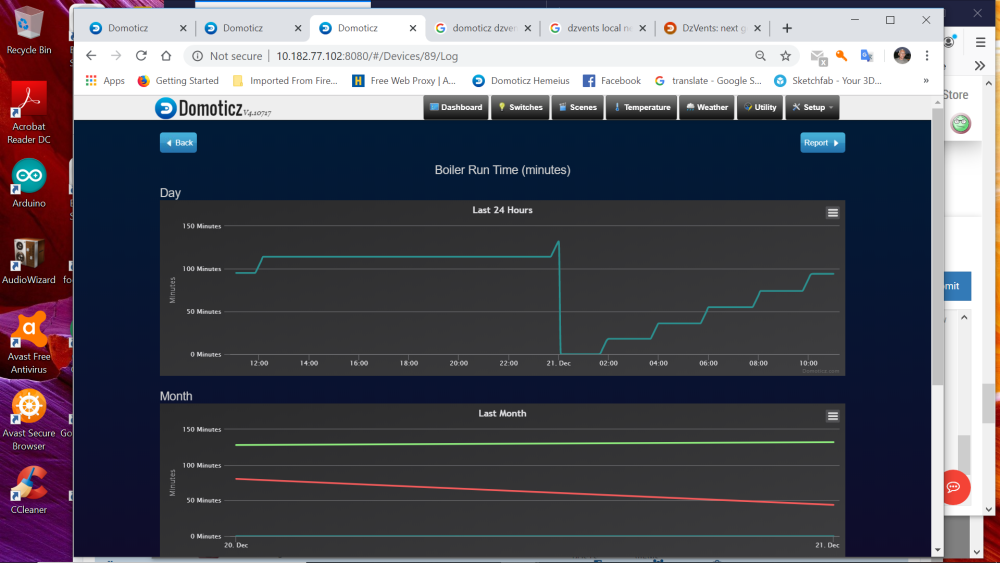
The recording script--- Update Boiler Run time record commandArray = {} TotalMinutesOn = otherdevices_svalues['Boiler Run Time (minutes)'] if otherdevices['Node 8 Boiler ON'] == 'On' then TotalMinutesOn = TotalMinutesOn + 1 end table.insert(commandArray, {['UpdateDevice'] = otherdevices_idx['Boiler Run Time (minutes)'] .. '|0|' .. TotalMinutesOn}) return commandArrayand the reset script-
--Reset Boiler Run Time to Zero at midnight
commandArray = {}
Time = os.date("%H:%M")
if Time == '00:00' then
  table.insert(commandArray, {['UpdateDevice'] = otherdevices_idx['Boiler Run Time (minutes)'] .. '|0|0'})
end
return commandArray
Despite some mucking about yesterday it is now doing precisely as intended, and Domoticz displays this to the default daily 5 minute "accuracy".
There are a many more refined external analysis tools, but as a simple working overview this does what I intended, and hopefully helps others newbies caught in similar WTF moments... -
@anand There was vastly more time wasted trying to get the original concept to work, than it look to learn basics of Domoticz scripting after finding a solution used by others.
The sketch complexity and size is dramarically reduced for the Node, it still responds to changes in boiler or PSU condition within a second, and reports temperatures and power condition regularly.
Domoticz reconciles everything to default 5 minute time slots, this method provides boiler run times to an accuracy of a minute which is quite adequate.
Hello! It looks like you're interested in this conversation, but you don't have an account yet.
Getting fed up of having to scroll through the same posts each visit? When you register for an account, you'll always come back to exactly where you were before, and choose to be notified of new replies (either via email, or push notification). You'll also be able to save bookmarks and upvote posts to show your appreciation to other community members.
With your input, this post could be even better 💗
Register Login