Skip to content
  • MySensors
  • OpenHardware.io
  • Categories
  • Recent
  • Tags
  • Popular
Skins
  • Light
  • Brite
  • Cerulean
  • Cosmo
  • Flatly
  • Journal
  • Litera
  • Lumen
  • Lux
  • Materia
  • Minty
  • Morph
  • Pulse
  • Sandstone
  • Simplex
  • Sketchy
  • Spacelab
  • United
  • Yeti
  • Zephyr
  • Dark
  • Cyborg
  • Darkly
  • Quartz
  • Slate
  • Solar
  • Superhero
  • Vapor

  • Default (No Skin)
  • No Skin
Collapse
Brand Logo
  1. Home
  2. General Discussion
  3. I would like to graph my sensors output

I would like to graph my sensors output

Scheduled Pinned Locked Moved General Discussion
veragraph
9 Posts 5 Posters 4.9k Views 2 Watching
  • Oldest to Newest
  • Newest to Oldest
  • Most Votes
Reply
  • Reply as topic
Log in to reply
This topic has been deleted. Only users with topic management privileges can see it.
  • 5546dug5 Offline
    5546dug5 Offline
    5546dug
    wrote on last edited by
    #1

    I am starting to get intErested in graphing a sensors output.
    For now I would probably use o/s temp as a sensor.

    Up for discussion is this .... What program do you use ?
    I have seen plotly, xlively and a couple of others .

    My HA system is Vera based, and uses win 8.1 on laptop
    Qatar the moment I use serial gw but have received the parts to try Ethernet gw for stability.
    At the moment I still run on ver 1.4 lib 1.4 as I have not upgraded yet.

    What are you guys using that is easy to setup and interpret?
    I tried xlively for an arduino based solar differential controller created by ?? Nateful I think, but did not extract to my satisfaction.

    1 Reply Last reply
    0
    • rvendrameR Offline
      rvendrameR Offline
      rvendrame
      Hero Member
      wrote on last edited by
      #2

      I use Datamine for Vera, it covered my needs on that, maybe you want to try it.

      Home Assistant / Vera Plus UI7
      ESP8266 GW + mySensors 2.3.2
      Alexa / Google Home

      1 Reply Last reply
      0
      • nutcrackerN Offline
        nutcrackerN Offline
        nutcracker
        wrote on last edited by
        #3

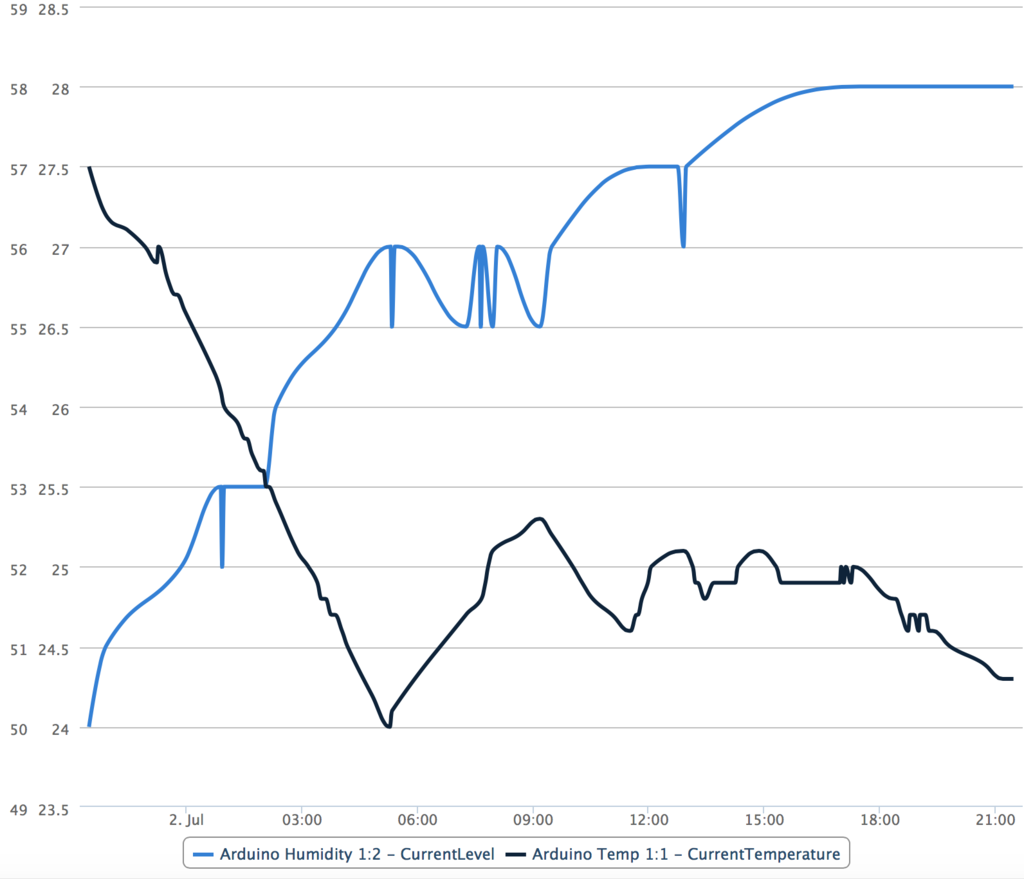
        My graph output when using Datamine and the new MySensors Sensebender boards...

        screenshot_1024.png

        1 Reply Last reply
        0
        • 5546dug5 Offline
          5546dug5 Offline
          5546dug
          wrote on last edited by
          #4

          @rvendrame ,@nutcracker , thanks for your response I have added the plug in to my Vera and am starting to get ready to try and graph.
          This looks as though it will fill my needs and more.

          Thanks Doug

          1 Reply Last reply
          0
          • 5546dug5 Offline
            5546dug5 Offline
            5546dug
            wrote on last edited by
            #5

            Of coarse I need this unit on Veralite and not on vera3 so now I need to build Ethernet gw first.
            Just a thought when the Veralite loses connection by power loss the serial gw requires reprogramming to be seen by Vera. So if usb drive is in slot when this occurres does it need reboot and/or does it have memory loss?
            Not too bad now but for winter it becomes the remote location.
            Another ? Can Ethernet gw be located anywhere on my home lab and not just in Veralite?

            1 Reply Last reply
            0
            • rvendrameR Offline
              rvendrameR Offline
              rvendrame
              Hero Member
              wrote on last edited by
              #6

              @5546dug , no you don't loose the data in usb stick when Vera reboots. And the ethernet GW can be anywhere, as long as a cable from your router can run to it ;-)

              Home Assistant / Vera Plus UI7
              ESP8266 GW + mySensors 2.3.2
              Alexa / Google Home

              1 Reply Last reply
              0
              • BulldogLowellB Offline
                BulldogLowellB Offline
                BulldogLowell
                Contest Winner
                wrote on last edited by
                #7

                Alternative, and you can avoid the overhead of the DataMine plugin, just transmit your sensor readings to a Google Drive spreadsheet instead.

                One of the weaknesses of Vera is that it doesn't really tell you you have a memory problem until all of a sudden the box becomes unstable and restarts over and over.

                1 Reply Last reply
                0
                • 5546dug5 Offline
                  5546dug5 Offline
                  5546dug
                  wrote on last edited by
                  #8

                  @BulldogLowell , have not heard of this will look up "google drive " on laptop when I get home ...... The learning continues.
                  Side bar..... Phoney TV ready for its box works great Bulldog, thanks

                  1 Reply Last reply
                  1
                  • NeverDieN Offline
                    NeverDieN Offline
                    NeverDie
                    Hero Member
                    wrote on last edited by NeverDie
                    #9

                    I'm using the free version of plot.ly to do plotting from an arduino. Here's a real-time feed, where you can see the effect of last night's irrigation on my soil moisture sensor readings:
                    https://plot.ly/~WhiteRabbit/997
                    It's very similar to Xively, but I like how I can easily pan and zoom the data. That's helpful as you get a bigger dataset, like this:
                    https://plot.ly/~WhiteRabbit/869/

                    Plot.ly has demo arduino code on their website you can use as a starting point.

                    Also, I have read how some people are using mysql to collect their data and graph it. I'd like to learn how to do that too, as I think it would be a good data archiving tool, and would provide additional ways to slice and dice the data.

                    With these solutions, you don't need to be dependent on owning or using a Vera.

                    I'd be interested to read about what other solutions people are using.

                    1 Reply Last reply
                    0
                    Reply
                    • Reply as topic
                    Log in to reply
                    • Oldest to Newest
                    • Newest to Oldest
                    • Most Votes


                    31

                    Online

                    11.7k

                    Users

                    11.2k

                    Topics

                    113.1k

                    Posts


                    Copyright 2025 TBD   |   Forum Guidelines   |   Privacy Policy   |   Terms of Service
                    • Login

                    • Don't have an account? Register

                    • Login or register to search.
                    • First post
                      Last post
                    0
                    • MySensors
                    • OpenHardware.io
                    • Categories
                    • Recent
                    • Tags
                    • Popular