sensor logging, and automation..
-
Is there anyone that do both automation jobs with mysensors, and log data from sensors, so they can be viewed easily on a "dashboard" kind of thing?
I am currently using PiDome, and it also do some logging of values. But I need to log into the server, in order to view the values. And I can not (at the moment) create a nice dashboard kind of thingie..
So I have been pushing the small bricks arround in my head trying to come up with a solution. PiDome is putting every measurement out as mqtt messages to clients, so I could just snatch them from there..
But then I need to store them. I have been looking at both rrd, and graphite, as well as using some kind of sql db as backend.
Also need to make the dashboard, showing nice graphs, and values. Main screen should show either an overview of the house, where I can see temperatures (main function of my sensor setup), in each room.. and then the ability to click through to see a graph of a single rooms sensor data for the last hour / day / week / whatever :)
Is there anyone here, that have had similar thoughts? and have done some of their own investigations? Before I push the bricks around until I get a headache? ;)
-
Well, I'm also moving bricks around in my head regarding the same matter.
My first test would be to use Mosquitto_sub in verbose mode with a Php script to load the db with raw data, in SQL you can later refine the data. That's how far my bricks have moved for now... :-) -
Is there anyone that do both automation jobs with mysensors, and log data from sensors, so they can be viewed easily on a "dashboard" kind of thing?
I am currently using PiDome, and it also do some logging of values. But I need to log into the server, in order to view the values. And I can not (at the moment) create a nice dashboard kind of thingie..
So I have been pushing the small bricks arround in my head trying to come up with a solution. PiDome is putting every measurement out as mqtt messages to clients, so I could just snatch them from there..
But then I need to store them. I have been looking at both rrd, and graphite, as well as using some kind of sql db as backend.
Also need to make the dashboard, showing nice graphs, and values. Main screen should show either an overview of the house, where I can see temperatures (main function of my sensor setup), in each room.. and then the ability to click through to see a graph of a single rooms sensor data for the last hour / day / week / whatever :)
Is there anyone here, that have had similar thoughts? and have done some of their own investigations? Before I push the bricks around until I get a headache? ;)
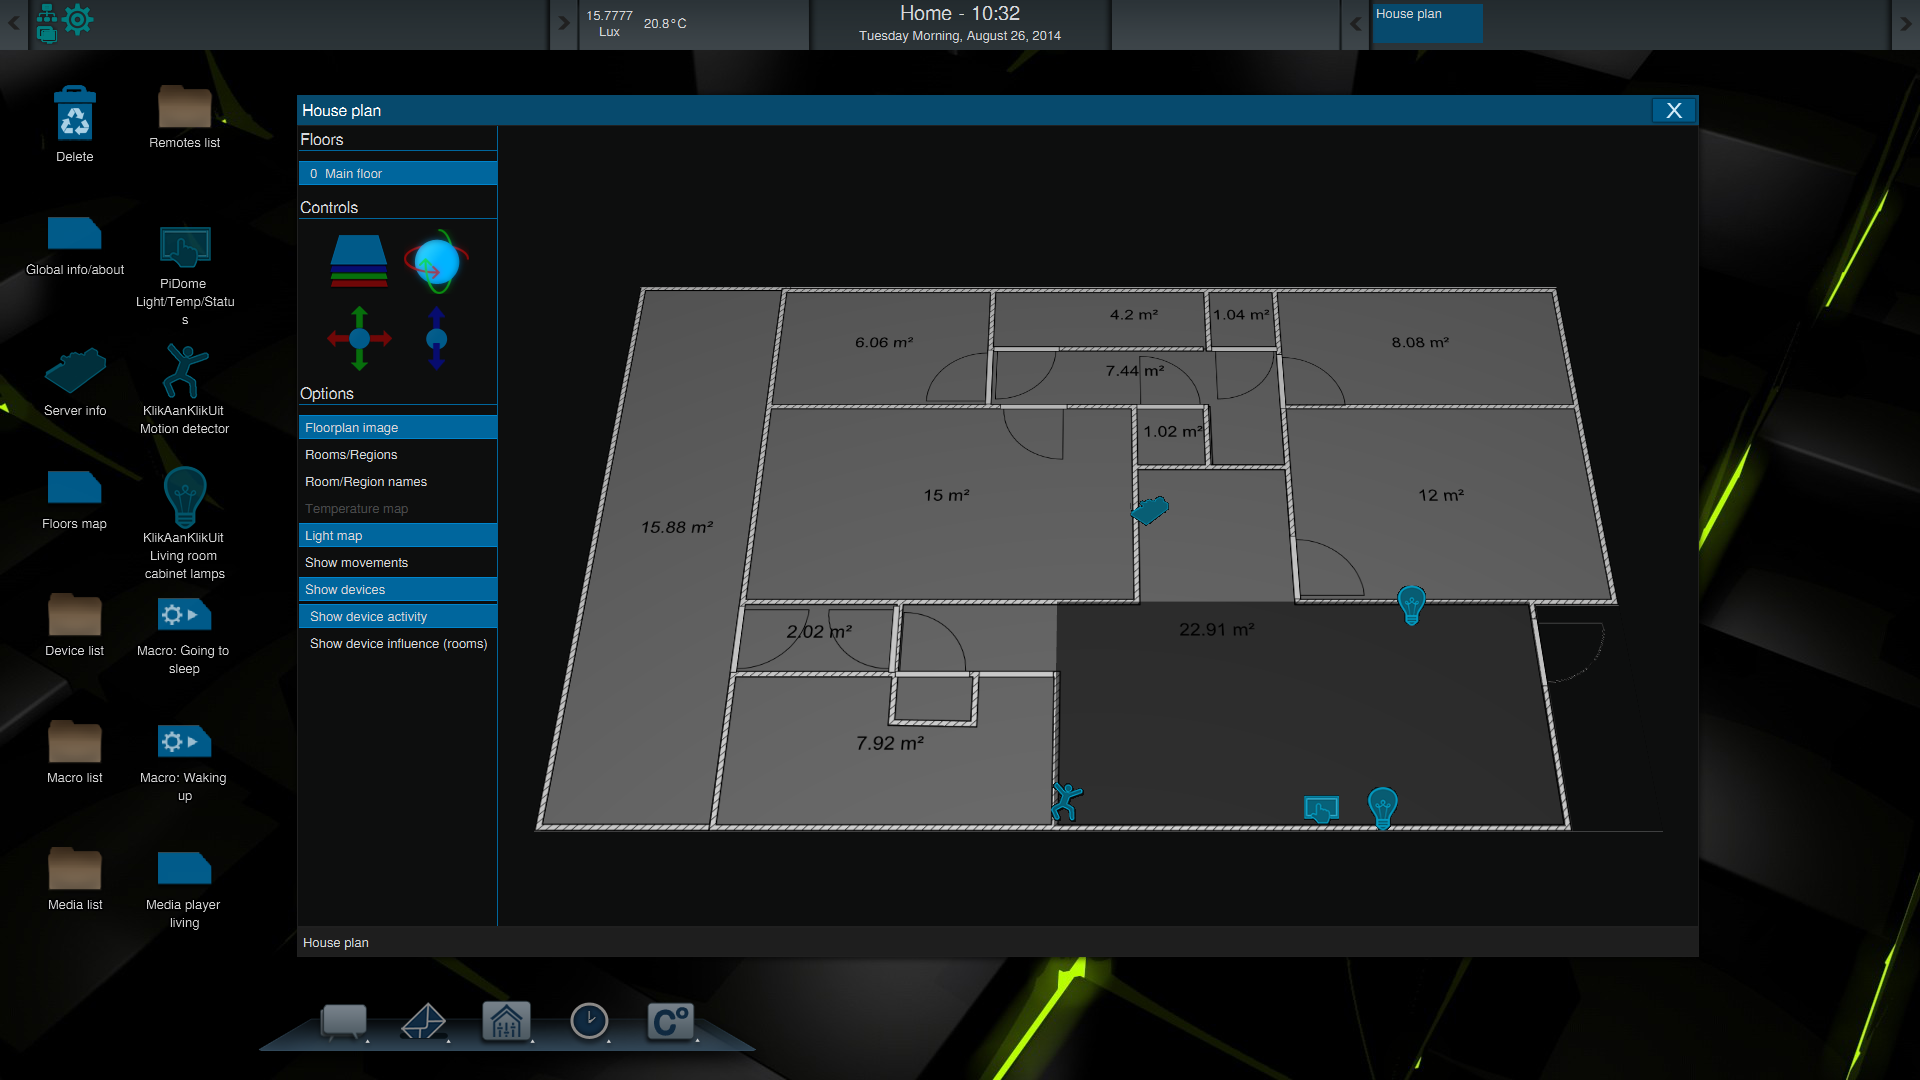
The desktop client makes it possible to view your house map with light intensities, temperatures and movements in rooms you can create in the web interface. Examples: https://pbs.twimg.com/media/Bv85-onIgAACF_8.png:large, https://www.youtube.com/watch?v=ktwtMa8Zd40. There will be a map view created for the web and other clients when the server has hit beta (this is the moment all the API's etc.. are completely frozen).
When a device is marked as a favorite it will appear on the main dashboard (be sure to assign a shortcut position to a control in the device editor). Custom dashboards are planned where you can put any thing on any location. The latter will be implemented first for clients.
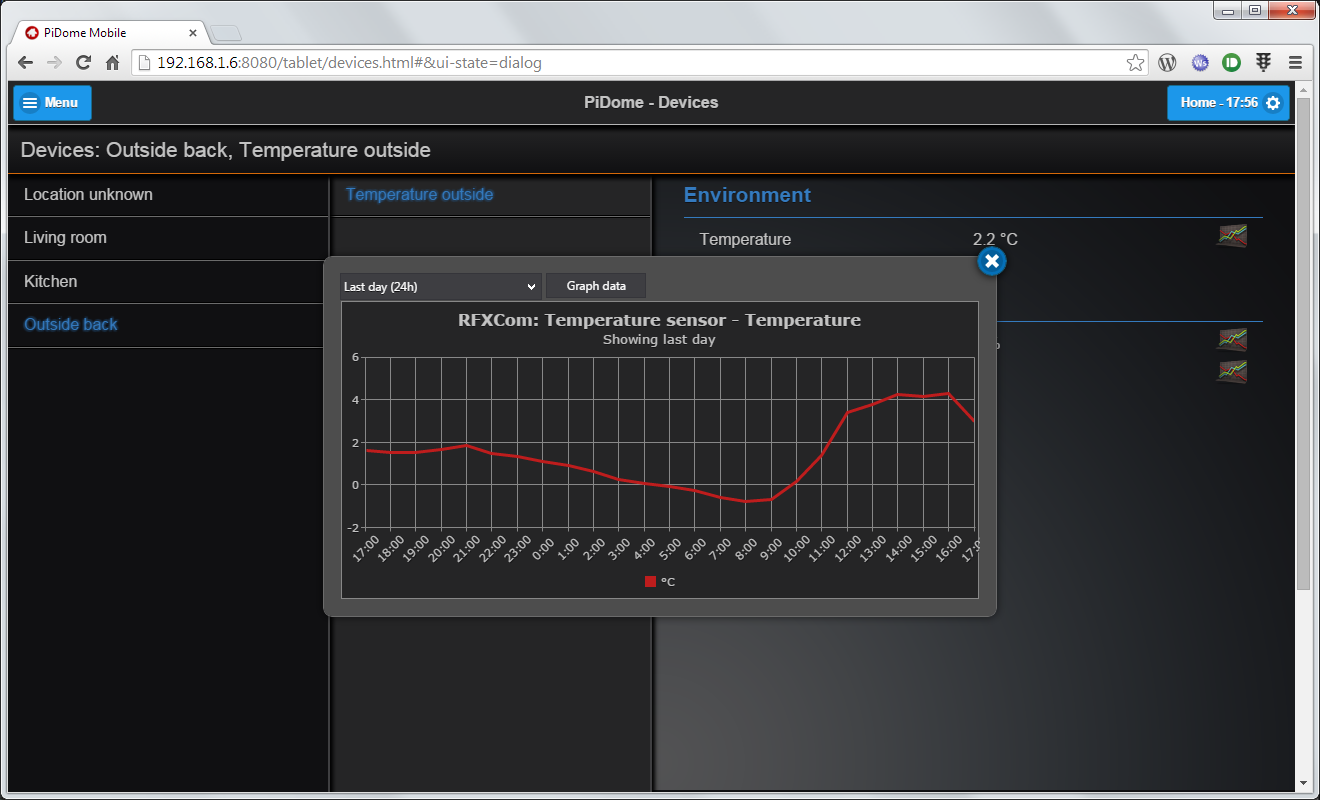
Values are also stored in device databases (when graphing is turned on), you can find them at databases/devices/[deviceid].data These are round robin databases, just like RRD does (all though not in rrd format). The database engine used is sqlite3. So you can create your own graphs reading these databases and read the raw data. Data is stored at the moment it is received (which can be delayed a bit if your server is very, very busy). Minute, and hourly data is rotated, daily cumulative stay forever.
Also every graph has an xml link (but yes, you need to be logged in to fetch these from http).
Also planned (yes there is a lot to do) is publishing the API by me (http://api.pidome.org has finally a place reserved). This means you can create your own web interfaces using JSON commands to be send to the server.
The server also exposes websockets and raw sockets, both also need you to be logged in, but they also expose all the device values.
Theoretically you could write PHP/anyother scripts that log in for you, store the cookie forever so you can use the XML data source.
You could also use the automation rules to pass on values to other http resources so these can store the data for you. Also planned (it's good you don't see the list) is a remote storage plugin so ALL data can be posted to an other resource.
[EDIT] typo's and more info[/EDIT]
P.S. Can i make the youtube view smaller or just only the link?
-
I knew about the graphing in pidome (at the moment, that's all I use it for..) . But it's a bit cumbersome to log into the server, and clicking arround to view the sensor data :) I want a more generic display that I could post to an old android tablet, for "house status" / "advanced weatherstation" display.
Think that I'll look into the sqlite files at first (then I can piggy back on pidome logging :))
Btw.. Is there any plans on having the android client behaving like the desktop client, that is showing the entire house, with sensor values?
@tbowmo
Yeah i know it can be annoying to log in all the time... I personally do think it can be sensitive data. Regarding the client interfaces eventually all will be synced, but can not give any estimates yet (i wish i could!).When the API is revealed you will be able to create anything you find fit to show. Everything, absolutely everything will be exposed via JSON-RPC (it already is, but not documented yet, if using chrome, take a look at the network tab in the webmaster tools).
There is work done on the tablet interface of the server (which got lost a while ago) which shows a client interface (works best in chrome for android/ipad also compatible, not fully tested yet):
https://pbs.twimg.com/media/B59SB6SCAAEztbI.png:large
https://twitter.com/Pi_Dome/status/547792858334638080/photo/1This is the first web interface that will also be able to show the floorplan and show weather info like the server does in the latest build:
https://twitter.com/Pi_Dome/status/553292628998230018/photo/1To use the tablet interface, you need to get the latest version. the login window shows a link to the tablet interface.
Good luck with the sqlite files, they are not password restricted.
-
The desktop client makes it possible to view your house map with light intensities, temperatures and movements in rooms you can create in the web interface. Examples: https://pbs.twimg.com/media/Bv85-onIgAACF_8.png:large, https://www.youtube.com/watch?v=ktwtMa8Zd40. There will be a map view created for the web and other clients when the server has hit beta (this is the moment all the API's etc.. are completely frozen).
When a device is marked as a favorite it will appear on the main dashboard (be sure to assign a shortcut position to a control in the device editor). Custom dashboards are planned where you can put any thing on any location. The latter will be implemented first for clients.
Values are also stored in device databases (when graphing is turned on), you can find them at databases/devices/[deviceid].data These are round robin databases, just like RRD does (all though not in rrd format). The database engine used is sqlite3. So you can create your own graphs reading these databases and read the raw data. Data is stored at the moment it is received (which can be delayed a bit if your server is very, very busy). Minute, and hourly data is rotated, daily cumulative stay forever.
Also every graph has an xml link (but yes, you need to be logged in to fetch these from http).
Also planned (yes there is a lot to do) is publishing the API by me (http://api.pidome.org has finally a place reserved). This means you can create your own web interfaces using JSON commands to be send to the server.
The server also exposes websockets and raw sockets, both also need you to be logged in, but they also expose all the device values.
Theoretically you could write PHP/anyother scripts that log in for you, store the cookie forever so you can use the XML data source.
You could also use the automation rules to pass on values to other http resources so these can store the data for you. Also planned (it's good you don't see the list) is a remote storage plugin so ALL data can be posted to an other resource.
[EDIT] typo's and more info[/EDIT]
P.S. Can i make the youtube view smaller or just only the link?
@John How did I not know about all of this. That is, I knew PiDome existed, but did not actually know what it was used for. This is a data nerds dream!
-
@John How did I not know about all of this. That is, I knew PiDome existed, but did not actually know what it was used for. This is a data nerds dream!
@NotYetRated
It is as young as it gets, not yet established and undocumented ;). Especially the last one needs immensive improvement
Hello! It looks like you're interested in this conversation, but you don't have an account yet.
Getting fed up of having to scroll through the same posts each visit? When you register for an account, you'll always come back to exactly where you were before, and choose to be notified of new replies (either via email, or push notification). You'll also be able to save bookmarks and upvote posts to show your appreciation to other community members.
With your input, this post could be even better 💗
Register Login