Handling NACKs


  • Hardware Contributor

    Re: Handling NACKs in the gateway

    Is it possible to catch an NACK in the code? Say to make an if (NACK) { Do stuff } ??


  • the send() function returns true if message reached the first stop on its way to destination.


  • Hardware Contributor

    @electrik - ok, so something like:

    
    void loop()     
    {   
        NACK = send(message to send);  
    if (NACK == 0) { Do stuff }
    }


  • @electrik hi. The is fine for a node where the code is part of the node sketch. However, because the gateway code is built into the libraries, it makes it difficult to implement in the gateway. As on the other thread one answer may be to change the controller code to request a confirmation from the gateway of delivery. In my case, I am using generic mqtt thing in openhab so not sure how to to be honest but will have a think.


  • Hardware Contributor

    @4994james - thanks James, but thats why I created a new thread, im interested in the node part. To create some sort of radio tester where you can send a message each second, get NACK or ACK and then output a signal/led when everything is fine to get some sort of coverage map of my house.


  • Mod


  • @sundberg84 yes exactly. I can look for a detailed example later


  • This what I borrowed and extended once

    
    boolean resend(MyMessage &msg, int repeats) // Resend messages if not received by gateway
    {
      int repeat = 0;
      int repeatDelay = 0;
      boolean ack = false; 
      uint8_t i;
        
      while (ack == false && repeat < repeats) 
      {
        wait(repeatDelay); 
        if (send(msg)) 
        {
          ack = true;
        }
        else 
        {
          ack = false;
          if (repeatDelay < 500)
            repeatDelay += 100;
        } 
        repeat++;
      }
      return (ack);
    }


    you can call it like the normal send function

      resend(msg, 3);


  • I count in every node, if send() returns false and send the number to controller to get an idea about rf quality.
    I do not retry, because Mysensors already retries, right?
    I use NFR24 and RFM69. Behavior is sometimes strange. No NACKs for weeks and then a really high number of NACKs for a few days. Setup not changed. I have no idea why... Same for indoor and outdoor sensors.


  • Hardware Contributor

    @karlheinz2000 - interesting, like a incrementing pulsecounter? Or what kind of sensor do you present to do this? Im thinking for a batterynode.


  • @sundberg84 - yes, it's just a 16bit incrementing counter. It counts all NACKs as long as the node is not reset.
    Before node goes to sleep, node sends the total number of NACKs. I'm using V_ID for that. Controller (FHEM) calculates then delta NACKs between two sends -> "lost messages". The lost messages are counted day by day separately. So I can easily see when during the day the lost messages rise and can also compare values day by day.
    I'm not using presentation that much. For most nodes I configure the controller manually. So I'm more flexible in which variables I can use in which context.


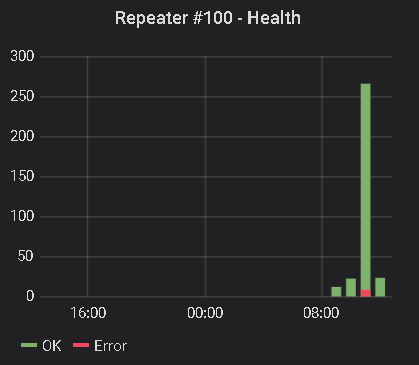
  • Yeah, using the return value of send() is a neat and simple way to get a rough estimate of how reliable a connection is. In my weather station prototype, I transmit up to 8 different sensor values every 5 minutes (if they exceeded a specified threshold compared to the previous measurement) and increase a tx_errors variable with each NACK and send that value at the end of each transmission period. tx_errors gets reset to 0 if its send() function returned true. If it sends a 0, it means that there were no transmission errors. This way it doubles as a heartbeat.

    mys-txerrors(2).png

    @electrik said in Handling NACKs:

    boolean resend(MyMessage &msg, int repeats) // Resend messages if not received by gateway
    {
    [...]
        if (send(msg)) 
    [...] 
    }
    

    I guess that you know that, but just to clarify: This code does not tell you that the gateway (destination node) received the message, unless the sending node is directly connected to it. Hardware ACK - via the return value of send() - only tells you that the first node (the sender's parent) on the way to the destination received the message.

    If you want to ensure that the gateway / destination received the message, you have to request an echo (send(msg, true)) and listen for it in receive(). Something like that:

    void receive(const MyMessage &message)
    {
        if (message.isEcho()) {
            // You received the echo
        }
    }
    

    Note: If you are using MySensors version lower than the current 2.3.2, then isEcho() is called isAck().


  • Hardware Contributor

    @BearWithBeard @karlheinz2000 - this is gold, thank you. I going to be a bit more annoying here 🙂

    What about doing this to a repeater?

    I have 3 main repeaters in my house. Do you know if it would be possible to catch the NACK / OK coming from all repeated messages? I guess we are talking changing in the core code?

    WOuld be awsome, to collect hourly OK and NACk and send to the controller for these three repeaters. It would indicate issues with both those three main nodes and also the network as a whole.


  • @sundberg84 Statistics are awesome, I like your thought! 👍

    But I'm afraid that you are right: There seems to be no easy way to get TX success indicators outside of the sending node. Atleast not without changes to the library.

    You can either ...

    • verify that the parent of the sender received the message (hardware ACK), or
    • verify that the destination (generally the gateway) received the message (software ACK / echo),

    ... but not if any of the parents successfully passed the message on.

    I guess, if you really wanted to, you could use direct node-to-node communication: On your sensor node, send the message to the nearest repeater, handle the message in receive() on the repeater and send it manually to the next repeater, until you reach the gateway. Then you should have full control over monitoring hardware ACK, at the cost of having a completely static network. I don't think that's desirable though...


  • Mod

    Maybe the indication handler could be used to count transmission failures?


  • I'm counting the send() fails and send that at intervals to the gateway as a child sensor.
    This won't work off course for repeaters so I guess @mfalkvidd's idea would do the trick.
    Or alternatively send dummy data, just to check the connection.


  • @karlheinz2000 said in Handling NACKs:

    I use NFR24 and RFM69. Behavior is sometimes strange. No NACKs for weeks and then a really high number of NACKs for a few days. Setup not changed. I have no idea why... Same for indoor and outdoor sensors.

    I've had similar effects and could relate this back to the gateway. I'm using an MQTT gateway and if that has Wifi connection issues, it is trying to reconnect to the network in a loop. During these retries it can't handle the NRF communication, if there are more messages than fit in the buffer.
    After solving these Wifi issues (updated the ESP32 core) and using the latest Mysensors release, things work much better.


  • Hardware Contributor

    @mfalkvidd - do you have a pointer to where I can start, bear in mind Im a very bad coder so I need somewhere to start following the logic.


  • Mod

    @sundberg84 seems like it isn't very well documented, but https://forum.mysensors.org/topic/7181/what-do-the-error-led-flashes-mean/9?_=1582119986104 has some information.

    increasing a counter for every INDICATION_ERR_TX and another counter for every INDICATION_TX could be sufficient to get a good ratio of how many successful and failed transmissions there are.

    Edit: https://forum.mysensors.org/post/89230 might be better to start from


  • Mod

    Something like this should work. Not sure if a power meter is the best way to present to controller, fee free to use something better.

    // Enable debug prints to serial monitor
    #define MY_DEBUG
    
    // Enable and select radio type attached
    #define MY_RADIO_RF24
    //#define MY_RADIO_NRF5_ESB
    //#define MY_RADIO_RFM69
    //#define MY_RADIO_RFM95
    
    // Enabled repeater feature for this node
    #define MY_REPEATER_FEATURE
    
    #define MY_INDICATION_HANDLER
    static uint32_t txOK = 0;
    static uint32_t txERR = 0;
    #define REPORT_INTERVAL 300000 // Report every 5 minutes
    #define CHILD_ID_TX_OK 1
    #define CHILD_ID_TX_ERR 2
    
    #include <MySensors.h>
    
    MyMessage txOKmsg(CHILD_ID_TX_OK, V_KWH);
    MyMessage txERRmsg(CHILD_ID_TX_ERR, V_KWH);
    
    void indication(indication_t ind)
    {
      switch (ind)
      {
        case INDICATION_TX:
          txOK++;
          break;
        case INDICATION_ERR_TX:
          txERR++;
          break;
      }
    }
    
    void setup()
    {
    
    }
    
    void presentation()
    {
      //Send the sensor node sketch version information to the gateway
      sendSketchInfo(F("Repeater Node"), F("1.0"));
      present(CHILD_ID_TX_OK, S_POWER);
      present(CHILD_ID_TX_ERR, S_POWER);
    }
    
    void loop()
    {
      static unsigned long last_send = 0;
      if (millis() - last_send > REPORT_INTERVAL) {
        send(txOKmsg.set(txOK));
        send(txERRmsg.set(txERR));
        last_send=millis();
      }
    }


    The same could probably be added to any gateway sketch.


  • Hardware Contributor

    @mfalkvidd - appreciate you time here, should have taken me hours and hours!


  • Mod

    @sundberg84 you're welcome. I'm trying to add the feature to one of my gateways now (I don't have any repeaters).


  • @mfalkvidd I won't sleep tonight now! - Can't wait to see how it works out in the 'real world' for you....


  • Mod

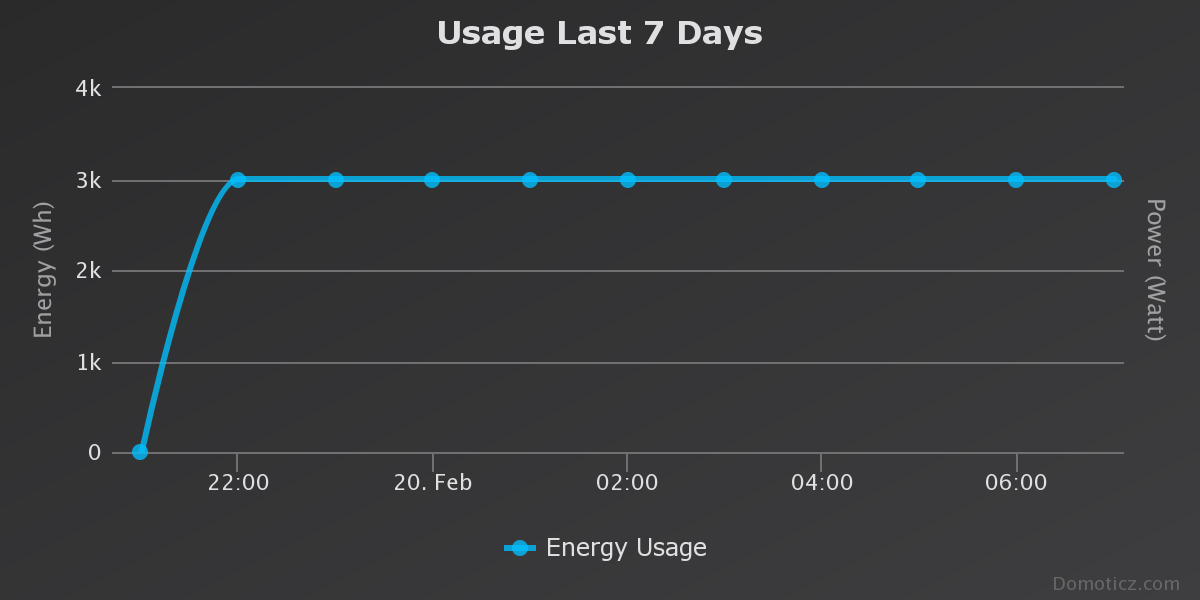
    @skywatch so far it is not showing anything interesting. On the other hand, I don't think my GW will transmit anything (no nodes request anything from the controller). This is what it looks like in Domoticz:
    99630ff0-30bc-4b3b-966d-77dc72ba340f-image.png

    I'll let it run overnight, will post an update tomorrow.


  • Mod

    As expected, there have been no errors recorded. The number of TX OK per hour is constant.
    Domoticz log file shows that the gateway reports every 5 minutes.
    usage-last-7-days.png

    Maybe the gateway should look at INDICATION_GW_TX.


  • Hardware Contributor

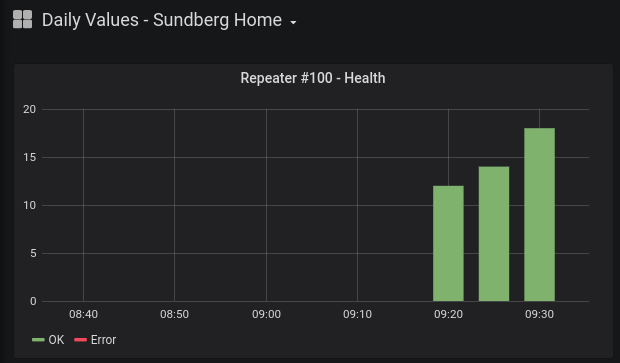
    @mfalkvidd - INDICATION_GW_TX sounds like a good plan. This is a great tool I think for the future to evaluate and debug your network. I used S_CUSTOM and a utility meter (hourly) in HA to get the values.

    Just started up, first values in - will report back when I have more data:
    No errors so far 🙂

    Just so I understand: case INDICATION_ERR_TX: means NACK ?
    ded136f0-d906-4102-bfc6-daa433bf8763-image.png


  • Mod

    @sundberg84 I think so.

    https://github.com/mysensors/MySensors/blob/79d7977cff47555d7bc812036caa6159df9cc8c7/core/MyTransport.cpp#L560 (I've cut out some code for brevity)

    	const bool result = transportSendWrite(route, message);
    #if !defined(MY_GATEWAY_FEATURE)
    	// update counter
    	if (route == _transportConfig.parentNodeId) {
    
    		if (!result) {
    			setIndication(INDICATION_ERR_TX);
    			_transportSM.failedUplinkTransmissions++;
    		} else {
    			_transportSM.failedUplinkTransmissions = 0u;
    		}
    	}
    #else
    	if(!result) {
    		setIndication(INDICATION_ERR_TX);
    	}
    #endif


    https://github.com/mysensors/MySensors/blob/79d7977cff47555d7bc812036caa6159df9cc8c7/core/MyTransport.h#L433

    /**
    * @brief Send message to recipient
    * @param to Recipient of message
    * @param message
    * @return true if message sent successfully
    */
    

    I guess we could use _transportSM.failedUplinkTransmissions instead of using our own counter.


  • @mfalkvidd said in Handling NACKs:

    I guess we could use _transportSM.failedUplinkTransmissions instead of using our own counter.

    That one is reset when a message is sent successfully, and we want to know the total number of failed msgs right?


  • Mod

    @electrik I see. Good point.


  • Hardware Contributor

    Something strange happened last hour:

    521328c2-1331-4efb-8998-956c027748f7-image.png

    But atleast now I know something is up.


  • @sundberg84 said in Handling NACKs:

    Something strange happened last hour:

    @sundberg84 - OMG, I have sat through whole flims with less suspense than this thread! ......


  • Mod

    @sundberg84 that's a very nice visual representation. Could you share how you set that up in HA?


  • Hardware Contributor

    @mfalkvidd - its accually Grafana and Influx database. So HA sends values to Influx which are visually presented in Grafana. Im sure you can do this from Domoticz as well... there are some limitations in Influx db so I might change to another database in the future which suits me better.


  • Mod

    @sundberg84 sorry for going off topic, but what limitations have you experienced?

    I've been thinking about using something better than Domoticz for a long time. Maybe Grafana is the way to go.


  • @mfalkvidd Domoticz is a full-blown home automation system, isn't it? Grafana is just a monitoring dashboard that pulls data from a time-series database (like InfluxDB) and generates fancy graphs. It can't automate and control things or send commands other than alarms (eg. if a value exceeds a threshold, or no new data came in since x minutes, send an email).

    One of InfluxDBs limitations is that you can't use (or only some basic) math operations on db queries, which may limit what you can graph in Grafana. Also, changing data types of existing fields in measurements is also not possible, which is annoying, because Grafana treats values differently based on their data type. @sundberg84 can probably name more limitations. I'd love to switch to Carbon / Graphite for data collection and storage... if only it wouldn't take time to read up, setup and migrate all the data. 😫

    By the way - great idea to use the indication handler to log radio reliability! 👍 Definitely going to implement this on my gateways repeaters when I find the time.


  • Hardware Contributor

    @mfalkvidd - @BearWithBeard said it. The limitations are mostly math related. For example, you cant show a graph with current and last years values (timeshift) on the same graph due to that limitation in InfluxDB. I want to compare power usage this day to same day last year - not possible. Im looking to change to Graphite as well instead of Influx.

    Moving from Domoticz to HA was a great move for me, but not as i thought. Im using HA more or less just as an umbrella. I would say im using only the OS Hass.IO and not using Home Assistant that much. Whats good in Home Assistant is that its quite easy to integrate different protocolls like MySensors or whatever you use. But after that I dont use Home Assistant but the great possibilities to have add-ons on Hass.IO. I use Node Red for all my automations (Extremly easy compared to code!), Influx + Grafana for visual, motionEyeOs for camera secutiry and more... all you have to do is install the addon from the "store" and you are more or less ready to go. These addons im sure you can install with domoticz as well if you like the integrations with the different protocolls there.

    i think we have handeled the NACK questions so no worries for me if we go off topic, but if you rather like send me a dm.


  • Hardware Contributor

    I just love this idea. Implemented the code on my second now, one to go.

    c33a129c-12ef-4a22-a966-d7c0dbe3847b-image.png


  • Mod

    @sundberg84 very nice. I'm happy we were able to implement it with so little effort. What does your graph look like now?

    Mine is very boring, as I suspected. Don't have any outgoing traffic from my GW. Will have to add it to my nodes to get any useful data.

    4c010679-17fa-4779-ac38-84b3642f3056-image.png
    7fc8c6a8-6006-4fc7-a189-ab2d2e9dce05-image.png


  • Hardware Contributor

    @mfalkvidd i didnt fins time yet to implement more. But very good for two repeaters.

    Screenshot_20200225-100340.png


  • Plugin Developer

    Very cool stuff.

    @mfalkvidd Would it be possible to create the functionality, but to measure the successrate of outgoing messages from the gateway node?

    For example, I'l love to be able to see how often the controller/gateway tries to toggle a distant node, but fails.


  • Mod

    @alowhum unless I misunderstand your suggestion, that's exactly what I have already done.


  • Plugin Developer

    Ah, now I see. Thanks!


  • @sundberg84 If I get it correct you implemented in your repeater sketch the use of the MySensors indication handler?

    void indication(indication_t ind)
    {
      switch (ind)
      {
        case INDICATION_TX:
          txOK++;
          break;
        case INDICATION_ERR_TX:
          txERR++;
          break;
      }
    }
    

    txOk and txErr are always incremented in the sketch and send to the gateway.
    Yet I see in your graphs a hourly count? Graphs from Grafana?
    Can you explain how you did this?


  • Hardware Contributor

    @evb - yes, that is correct, here is a complete sketch with a GW (Nrf24 - ethernet)

    // Enable debug prints to serial monitor
    #define MY_DEBUG
    
    // Enable and select radio type attached
    #define MY_RADIO_NRF24
    #define MY_RF24_PA_LEVEL RF24_PA_MAX
    
    // Enable gateway ethernet module type
    #define MY_GATEWAY_W5100
    
    // Enable Soft SPI for NRF radio (note different radio wiring is required)
    // The W5100 ethernet module seems to have a hard time co-operate with
    // radio on the same spi bus.
    #if !defined(MY_W5100_SPI_EN) && !defined(ARDUINO_ARCH_SAMD)
    #define MY_SOFTSPI
    #define MY_SOFT_SPI_SCK_PIN 14
    #define MY_SOFT_SPI_MISO_PIN 16
    #define MY_SOFT_SPI_MOSI_PIN 15
    #endif
    
    // When W5100 is connected we have to move CE/CSN pins for NRF radio
    #ifndef MY_RF24_CE_PIN
    #define MY_RF24_CE_PIN 5
    #endif
    #ifndef MY_RF24_CS_PIN
    #define MY_RF24_CS_PIN 6
    #endif
    
    #define MY_IP_ADDRESS 192,168,1,8   // If this is disabled, DHCP is used to retrieve address
    // Renewal period if using DHCP
    //#define MY_IP_RENEWAL_INTERVAL 60000
    // The port to keep open on node server mode / or port to contact in client mode
    #define MY_PORT 5003
    
    // Controller ip address. Enables client mode (default is "server" mode).
    // Also enable this if MY_USE_UDP is used and you want sensor data sent somewhere.
    //#define MY_CONTROLLER_IP_ADDRESS 192, 168, 178, 254
    
    // The MAC address can be anything you want but should be unique on your network.
    // Newer boards have a MAC address printed on the underside of the PCB, which you can (optionally) use.
    // Note that most of the Ardunio examples use  "DEAD BEEF FEED" for the MAC address.
    #define MY_MAC_ADDRESS 0xDE, 0xAD, 0xBE, 0xEF, 0x01, 0x08 //AF-A0-F2-15-3B-1C
    
    // Set blinking period
    #define MY_DEFAULT_LED_BLINK_PERIOD 300
    
    // Enable inclusion mode
    //#define MY_INCLUSION_MODE_FEATURE
    // Enable Inclusion mode button on gateway
    //#define MY_INCLUSION_BUTTON_FEATURE
    // Set inclusion mode duration (in seconds)
    //#define MY_INCLUSION_MODE_DURATION 60
    // Digital pin used for inclusion mode button
    //#define MY_INCLUSION_MODE_BUTTON_PIN  3
    
    // Uncomment to override default HW configurations
    #define MY_DEFAULT_ERR_LED_PIN 7  // Error led pin
    #define MY_DEFAULT_RX_LED_PIN  9  // Receive led pin
    #define MY_DEFAULT_TX_LED_PIN  8  // the PCB, on board LED
    
    
    #define MY_INDICATION_HANDLER
    static uint32_t txOK = 0;
    static uint32_t txERR = 0;
    #define REPORT_INTERVAL 300000 // Report every 5 minutes
    #define CHILD_ID_TX_OK 0
    #define CHILD_ID_TX_ERR 1
    
    #include <SPI.h>
    
    #if defined(MY_USE_UDP)
    #include <EthernetUdp.h>
    #endif
    #include <Ethernet.h>
    #include <MySensors.h>
    
    MyMessage txOKmsg(CHILD_ID_TX_OK, V_CUSTOM);
    MyMessage txERRmsg(CHILD_ID_TX_ERR, V_CUSTOM);
    
    void indication(indication_t ind)
    {
      switch (ind)
      {
        case INDICATION_TX:
          txOK++;
          break;
        case INDICATION_ERR_TX:
          txERR++;
          break;
      }
    }
    
    void presentation()
    {
      //Send the sensor node sketch version information to the gateway
      sendSketchInfo("Gateway #1", "1.0");
      present(CHILD_ID_TX_OK, S_CUSTOM);
      present(CHILD_ID_TX_ERR, S_CUSTOM);
    }
    
    void setup()
    {
    }
    
    void loop() {
    
      static unsigned long last_send = 0;
      if (millis() - last_send > REPORT_INTERVAL) {
        send(txOKmsg.set(txOK));
        send(txERRmsg.set(txERR));
        last_send = millis();
      }
    
    }


    In Home Assistant you need to create a sensor that breaks down the incrementing number to each intervall you want.
    I use a utility_meter.

    utility_meter:
    hourly_ok_gw:
        source: sensor.gateway_1_0_0
        cycle: hourly
      hourly_err_gw:
        source: sensor.gateway_1_0_1
        cycle: hourly
    

    This sensors will be sent to Grafana each hour just like any other sensor and you can create a graph there:

    2556f0fa-a34b-49da-bac6-e0a8aadbd633-image.png


Log in to reply
 

Suggested Topics

93
Online

11.5k
Users

11.1k
Topics

112.7k
Posts