Handling NACKs
-
Very cool stuff.
@mfalkvidd Would it be possible to create the functionality, but to measure the successrate of outgoing messages from the gateway node?
For example, I'l love to be able to see how often the controller/gateway tries to toggle a distant node, but fails.
-
Ah, now I see. Thanks!
-
@mfalkvidd i didnt fins time yet to implement more. But very good for two repeaters.
@sundberg84 If I get it correct you implemented in your repeater sketch the use of the MySensors indication handler?
void indication(indication_t ind)
{
  switch (ind)
  {
    case INDICATION_TX:
      txOK++;
      break;
    case INDICATION_ERR_TX:
      txERR++;
      break;
  }
}
txOk and txErr are always incremented in the sketch and send to the gateway.
Yet I see in your graphs a hourly count? Graphs from Grafana?
Can you explain how you did this? -
@evb - yes, that is correct, here is a complete sketch with a GW (Nrf24 - ethernet)
// Enable debug prints to serial monitor
#define MY_DEBUG

// Enable and select radio type attached
#define MY_RADIO_NRF24
#define MY_RF24_PA_LEVEL RF24_PA_MAX

// Enable gateway ethernet module type
#define MY_GATEWAY_W5100

// Enable Soft SPI for NRF radio (note different radio wiring is required)
// The W5100 ethernet module seems to have a hard time co-operate with
// radio on the same spi bus.
#if !defined(MY_W5100_SPI_EN) && !defined(ARDUINO_ARCH_SAMD)
#define MY_SOFTSPI
#define MY_SOFT_SPI_SCK_PIN 14
#define MY_SOFT_SPI_MISO_PIN 16
#define MY_SOFT_SPI_MOSI_PIN 15
#endif

// When W5100 is connected we have to move CE/CSN pins for NRF radio
#ifndef MY_RF24_CE_PIN
#define MY_RF24_CE_PIN 5
#endif
#ifndef MY_RF24_CS_PIN
#define MY_RF24_CS_PIN 6
#endif

#define MY_IP_ADDRESS 192,168,1,8   // If this is disabled, DHCP is used to retrieve address
// Renewal period if using DHCP
//#define MY_IP_RENEWAL_INTERVAL 60000
// The port to keep open on node server mode / or port to contact in client mode
#define MY_PORT 5003

// Controller ip address. Enables client mode (default is "server" mode).
// Also enable this if MY_USE_UDP is used and you want sensor data sent somewhere.
//#define MY_CONTROLLER_IP_ADDRESS 192, 168, 178, 254

// The MAC address can be anything you want but should be unique on your network.
// Newer boards have a MAC address printed on the underside of the PCB, which you can (optionally) use.
// Note that most of the Ardunio examples use  "DEAD BEEF FEED" for the MAC address.
#define MY_MAC_ADDRESS 0xDE, 0xAD, 0xBE, 0xEF, 0x01, 0x08 //AF-A0-F2-15-3B-1C

// Set blinking period
#define MY_DEFAULT_LED_BLINK_PERIOD 300

// Enable inclusion mode
//#define MY_INCLUSION_MODE_FEATURE
// Enable Inclusion mode button on gateway
//#define MY_INCLUSION_BUTTON_FEATURE
// Set inclusion mode duration (in seconds)
//#define MY_INCLUSION_MODE_DURATION 60
// Digital pin used for inclusion mode button
//#define MY_INCLUSION_MODE_BUTTON_PIN  3

// Uncomment to override default HW configurations
#define MY_DEFAULT_ERR_LED_PIN 7  // Error led pin
#define MY_DEFAULT_RX_LED_PIN  9  // Receive led pin
#define MY_DEFAULT_TX_LED_PIN  8  // the PCB, on board LED


#define MY_INDICATION_HANDLER
static uint32_t txOK = 0;
static uint32_t txERR = 0;
#define REPORT_INTERVAL 300000 // Report every 5 minutes
#define CHILD_ID_TX_OK 0
#define CHILD_ID_TX_ERR 1

#include <SPI.h>

#if defined(MY_USE_UDP)
#include <EthernetUdp.h>
#endif
#include <Ethernet.h>
#include <MySensors.h>

MyMessage txOKmsg(CHILD_ID_TX_OK, V_CUSTOM);
MyMessage txERRmsg(CHILD_ID_TX_ERR, V_CUSTOM);

void indication(indication_t ind)
{
  switch (ind)
  {
    case INDICATION_TX:
      txOK++;
      break;
    case INDICATION_ERR_TX:
      txERR++;
      break;
  }
}

void presentation()
{
  //Send the sensor node sketch version information to the gateway
  sendSketchInfo("Gateway #1", "1.0");
  present(CHILD_ID_TX_OK, S_CUSTOM);
  present(CHILD_ID_TX_ERR, S_CUSTOM);
}

void setup()
{
}

void loop() {

  static unsigned long last_send = 0;
  if (millis() - last_send > REPORT_INTERVAL) {
    send(txOKmsg.set(txOK));
    send(txERRmsg.set(txERR));
    last_send = millis();
  }

}
In Home Assistant you need to create a sensor that breaks down the incrementing number to each intervall you want.
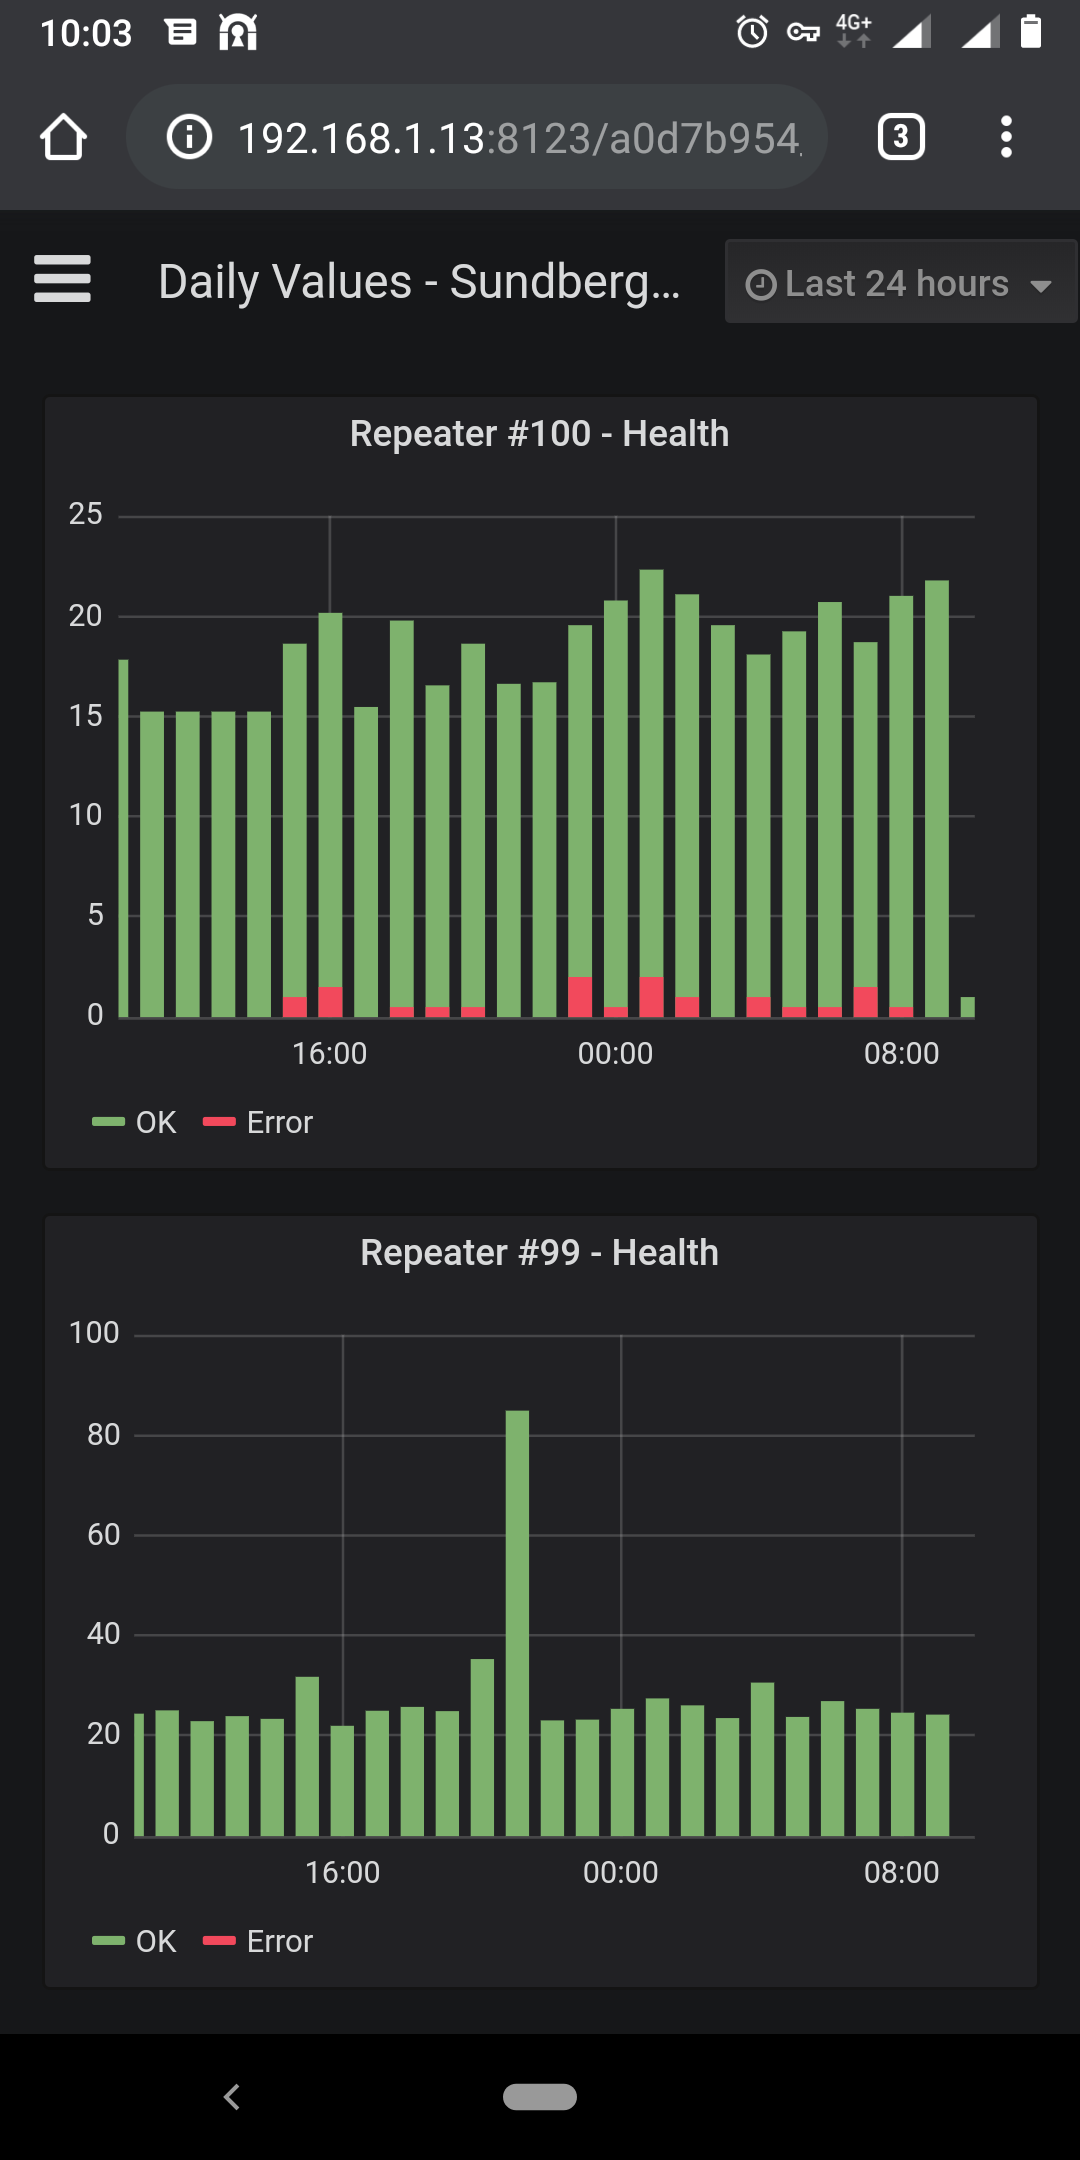
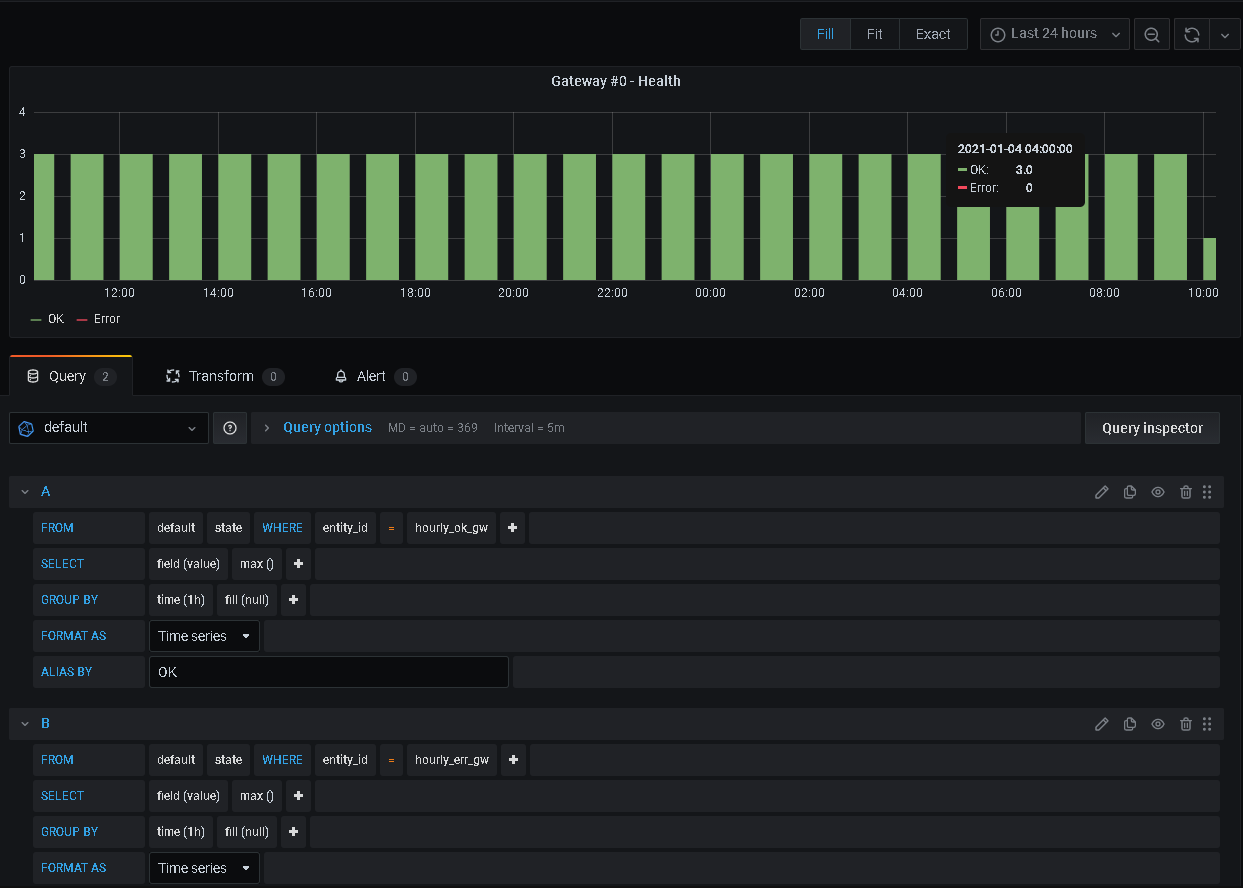
I use a utility_meter.utility_meter: hourly_ok_gw: source: sensor.gateway_1_0_0 cycle: hourly hourly_err_gw: source: sensor.gateway_1_0_1 cycle: hourlyThis sensors will be sent to Grafana each hour just like any other sensor and you can create a graph there:
Hello! It looks like you're interested in this conversation, but you don't have an account yet.
Getting fed up of having to scroll through the same posts each visit? When you register for an account, you'll always come back to exactly where you were before, and choose to be notified of new replies (either via email, or push notification). You'll also be able to save bookmarks and upvote posts to show your appreciation to other community members.
With your input, this post could be even better 💗
Register Login