Handling NACKs
-
Re: Handling NACKs in the gateway
Is it possible to catch an NACK in the code? Say to make an if (NACK) { Do stuff } ??
-
the send() function returns true if message reached the first stop on its way to destination.
@electrik - ok, so something like:
void loop() { NACK = send(message to send); if (NACK == 0) { Do stuff } } -
the send() function returns true if message reached the first stop on its way to destination.
@electrik hi. The is fine for a node where the code is part of the node sketch. However, because the gateway code is built into the libraries, it makes it difficult to implement in the gateway. As on the other thread one answer may be to change the controller code to request a confirmation from the gateway of delivery. In my case, I am using generic mqtt thing in openhab so not sure how to to be honest but will have a think.
-
@electrik hi. The is fine for a node where the code is part of the node sketch. However, because the gateway code is built into the libraries, it makes it difficult to implement in the gateway. As on the other thread one answer may be to change the controller code to request a confirmation from the gateway of delivery. In my case, I am using generic mqtt thing in openhab so not sure how to to be honest but will have a think.
@4994james - thanks James, but thats why I created a new thread, im interested in the node part. To create some sort of radio tester where you can send a message each second, get NACK or ACK and then output a signal/led when everything is fine to get some sort of coverage map of my house.
Controller: Proxmox VM - Home Assistant
MySensors GW: Arduino Uno - W5100 Ethernet, Gw Shield Nrf24l01+ 2,4Ghz
MySensors GW: Arduino Uno - Gw Shield RFM69, 433mhz
RFLink GW - Arduino Mega + RFLink Shield, 433mhz -
@4994james - thanks James, but thats why I created a new thread, im interested in the node part. To create some sort of radio tester where you can send a message each second, get NACK or ACK and then output a signal/led when everything is fine to get some sort of coverage map of my house.
@sundberg84 sounds similar to https://forum.mysensors.org/topic/9178/nrf24doctor ?
-
@electrik - ok, so something like:
void loop() { NACK = send(message to send); if (NACK == 0) { Do stuff } }@sundberg84 yes exactly. I can look for a detailed example later
-
This what I borrowed and extended once
boolean resend(MyMessage &msg, int repeats) // Resend messages if not received by gateway
{
  int repeat = 0;
  int repeatDelay = 0;
  boolean ack = false;
  uint8_t i;

  while (ack == false && repeat < repeats)
  {
    wait(repeatDelay);
    if (send(msg))
    {
      ack = true;
    }
    else
    {
      ack = false;
      if (repeatDelay < 500)
        repeatDelay += 100;
    }
    repeat++;
  }
  return (ack);
}
you can call it like the normal send function
resend(msg, 3); -
I count in every node, if send() returns false and send the number to controller to get an idea about rf quality.
I do not retry, because Mysensors already retries, right?
I use NFR24 and RFM69. Behavior is sometimes strange. No NACKs for weeks and then a really high number of NACKs for a few days. Setup not changed. I have no idea why... Same for indoor and outdoor sensors. -
I count in every node, if send() returns false and send the number to controller to get an idea about rf quality.
I do not retry, because Mysensors already retries, right?
I use NFR24 and RFM69. Behavior is sometimes strange. No NACKs for weeks and then a really high number of NACKs for a few days. Setup not changed. I have no idea why... Same for indoor and outdoor sensors.@karlheinz2000 - interesting, like a incrementing pulsecounter? Or what kind of sensor do you present to do this? Im thinking for a batterynode.
-
@sundberg84 - yes, it's just a 16bit incrementing counter. It counts all NACKs as long as the node is not reset.
Before node goes to sleep, node sends the total number of NACKs. I'm using V_ID for that. Controller (FHEM) calculates then delta NACKs between two sends -> "lost messages". The lost messages are counted day by day separately. So I can easily see when during the day the lost messages rise and can also compare values day by day.
I'm not using presentation that much. For most nodes I configure the controller manually. So I'm more flexible in which variables I can use in which context. -
This what I borrowed and extended once
boolean resend(MyMessage &msg, int repeats) // Resend messages if not received by gateway
{
  int repeat = 0;
  int repeatDelay = 0;
  boolean ack = false;
  uint8_t i;

  while (ack == false && repeat < repeats)
  {
    wait(repeatDelay);
    if (send(msg))
    {
      ack = true;
    }
    else
    {
      ack = false;
      if (repeatDelay < 500)
        repeatDelay += 100;
    }
    repeat++;
  }
  return (ack);
}
you can call it like the normal send function
resend(msg, 3);Yeah, using the return value of
send()is a neat and simple way to get a rough estimate of how reliable a connection is. In my weather station prototype, I transmit up to 8 different sensor values every 5 minutes (if they exceeded a specified threshold compared to the previous measurement) and increase atx_errorsvariable with each NACK and send that value at the end of each transmission period.tx_errorsgets reset to 0 if itssend()function returnedtrue. If it sends a 0, it means that there were no transmission errors. This way it doubles as a heartbeat.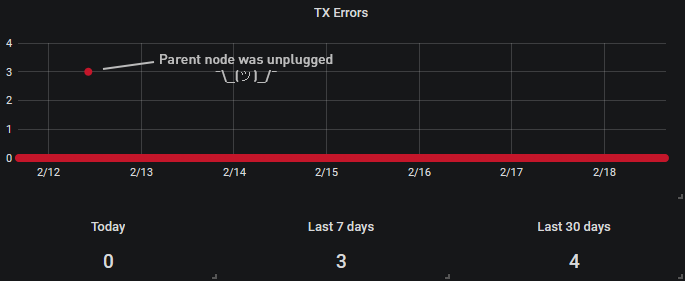
@electrik said in Handling NACKs:
boolean resend(MyMessage &msg, int repeats) // Resend messages if not received by gateway
{

    if (send(msg))
[...]
}
I guess that you know that, but just to clarify: This code does not tell you that the gateway (destination node) received the message, unless the sending node is directly connected to it. Hardware ACK - via the return value of
send()- only tells you that the first node (the sender's parent) on the way to the destination received the message.If you want to ensure that the gateway / destination received the message, you have to request an echo (
send(msg, true)) and listen for it inreceive(). Something like that:void receive(const MyMessage &message) { if (message.isEcho()) { // You received the echo } }Note: If you are using MySensors version lower than the current 2.3.2, then
isEcho()is calledisAck(). -
Yeah, using the return value of
send()is a neat and simple way to get a rough estimate of how reliable a connection is. In my weather station prototype, I transmit up to 8 different sensor values every 5 minutes (if they exceeded a specified threshold compared to the previous measurement) and increase atx_errorsvariable with each NACK and send that value at the end of each transmission period.tx_errorsgets reset to 0 if itssend()function returnedtrue. If it sends a 0, it means that there were no transmission errors. This way it doubles as a heartbeat.@electrik said in Handling NACKs:
boolean resend(MyMessage &msg, int repeats) // Resend messages if not received by gateway
{

    if (send(msg))
[...]
}
I guess that you know that, but just to clarify: This code does not tell you that the gateway (destination node) received the message, unless the sending node is directly connected to it. Hardware ACK - via the return value of
send()- only tells you that the first node (the sender's parent) on the way to the destination received the message.If you want to ensure that the gateway / destination received the message, you have to request an echo (
send(msg, true)) and listen for it inreceive(). Something like that:void receive(const MyMessage &message) { if (message.isEcho()) { // You received the echo } }Note: If you are using MySensors version lower than the current 2.3.2, then
isEcho()is calledisAck().@BearWithBeard @karlheinz2000 - this is gold, thank you. I going to be a bit more annoying here :)
What about doing this to a repeater?
I have 3 main repeaters in my house. Do you know if it would be possible to catch the NACK / OK coming from all repeated messages? I guess we are talking changing in the core code?
WOuld be awsome, to collect hourly OK and NACk and send to the controller for these three repeaters. It would indicate issues with both those three main nodes and also the network as a whole.
Controller: Proxmox VM - Home Assistant
MySensors GW: Arduino Uno - W5100 Ethernet, Gw Shield Nrf24l01+ 2,4Ghz
MySensors GW: Arduino Uno - Gw Shield RFM69, 433mhz
RFLink GW - Arduino Mega + RFLink Shield, 433mhz -
@BearWithBeard @karlheinz2000 - this is gold, thank you. I going to be a bit more annoying here :)
What about doing this to a repeater?
I have 3 main repeaters in my house. Do you know if it would be possible to catch the NACK / OK coming from all repeated messages? I guess we are talking changing in the core code?
WOuld be awsome, to collect hourly OK and NACk and send to the controller for these three repeaters. It would indicate issues with both those three main nodes and also the network as a whole.
@sundberg84 Statistics are awesome, I like your thought! :+1:
But I'm afraid that you are right: There seems to be no easy way to get TX success indicators outside of the sending node. Atleast not without changes to the library.
You can either ...
- verify that the parent of the sender received the message (hardware ACK), or
- verify that the destination (generally the gateway) received the message (software ACK / echo),
... but not if any of the parents successfully passed the message on.
I guess, if you really wanted to, you could use direct node-to-node communication: On your sensor node, send the message to the nearest repeater, handle the message in
receive()on the repeater and send it manually to the next repeater, until you reach the gateway. Then you should have full control over monitoring hardware ACK, at the cost of having a completely static network. I don't think that's desirable though... -
I'm counting the send() fails and send that at intervals to the gateway as a child sensor.
This won't work off course for repeaters so I guess @mfalkvidd's idea would do the trick.
Or alternatively send dummy data, just to check the connection. -
I count in every node, if send() returns false and send the number to controller to get an idea about rf quality.
I do not retry, because Mysensors already retries, right?
I use NFR24 and RFM69. Behavior is sometimes strange. No NACKs for weeks and then a really high number of NACKs for a few days. Setup not changed. I have no idea why... Same for indoor and outdoor sensors.@karlheinz2000 said in Handling NACKs:
I use NFR24 and RFM69. Behavior is sometimes strange. No NACKs for weeks and then a really high number of NACKs for a few days. Setup not changed. I have no idea why... Same for indoor and outdoor sensors.
I've had similar effects and could relate this back to the gateway. I'm using an MQTT gateway and if that has Wifi connection issues, it is trying to reconnect to the network in a loop. During these retries it can't handle the NRF communication, if there are more messages than fit in the buffer.
After solving these Wifi issues (updated the ESP32 core) and using the latest Mysensors release, things work much better. -
@mfalkvidd - do you have a pointer to where I can start, bear in mind Im a very bad coder so I need somewhere to start following the logic.
Controller: Proxmox VM - Home Assistant
MySensors GW: Arduino Uno - W5100 Ethernet, Gw Shield Nrf24l01+ 2,4Ghz
MySensors GW: Arduino Uno - Gw Shield RFM69, 433mhz
RFLink GW - Arduino Mega + RFLink Shield, 433mhz -
@mfalkvidd - do you have a pointer to where I can start, bear in mind Im a very bad coder so I need somewhere to start following the logic.
@sundberg84 seems like it isn't very well documented, but https://forum.mysensors.org/topic/7181/what-do-the-error-led-flashes-mean/9?_=1582119986104 has some information.
increasing a counter for every INDICATION_ERR_TX and another counter for every INDICATION_TX could be sufficient to get a good ratio of how many successful and failed transmissions there are.
Edit: https://forum.mysensors.org/post/89230 might be better to start from
-
Something like this should work. Not sure if a power meter is the best way to present to controller, fee free to use something better.
// Enable debug prints to serial monitor
#define MY_DEBUG

// Enable and select radio type attached
#define MY_RADIO_RF24
//#define MY_RADIO_NRF5_ESB
//#define MY_RADIO_RFM69
//#define MY_RADIO_RFM95

// Enabled repeater feature for this node
#define MY_REPEATER_FEATURE

#define MY_INDICATION_HANDLER
static uint32_t txOK = 0;
static uint32_t txERR = 0;
#define REPORT_INTERVAL 300000 // Report every 5 minutes
#define CHILD_ID_TX_OK 1
#define CHILD_ID_TX_ERR 2

#include <MySensors.h>

MyMessage txOKmsg(CHILD_ID_TX_OK, V_KWH);
MyMessage txERRmsg(CHILD_ID_TX_ERR, V_KWH);

void indication(indication_t ind)
{
  switch (ind)
  {
    case INDICATION_TX:
      txOK++;
      break;
    case INDICATION_ERR_TX:
      txERR++;
      break;
  }
}

void setup()
{

}

void presentation()
{
  //Send the sensor node sketch version information to the gateway
  sendSketchInfo(F("Repeater Node"), F("1.0"));
  present(CHILD_ID_TX_OK, S_POWER);
  present(CHILD_ID_TX_ERR, S_POWER);
}

void loop()
{
  static unsigned long last_send = 0;
  if (millis() - last_send > REPORT_INTERVAL) {
    send(txOKmsg.set(txOK));
    send(txERRmsg.set(txERR));
    last_send=millis();
  }
}
The same could probably be added to any gateway sketch.
Hello! It looks like you're interested in this conversation, but you don't have an account yet.
Getting fed up of having to scroll through the same posts each visit? When you register for an account, you'll always come back to exactly where you were before, and choose to be notified of new replies (either via email, or push notification). You'll also be able to save bookmarks and upvote posts to show your appreciation to other community members.
With your input, this post could be even better 💗
Register Login