Handling NACKs
-
I'm counting the send() fails and send that at intervals to the gateway as a child sensor.
This won't work off course for repeaters so I guess @mfalkvidd's idea would do the trick.
Or alternatively send dummy data, just to check the connection. -
I count in every node, if send() returns false and send the number to controller to get an idea about rf quality.
I do not retry, because Mysensors already retries, right?
I use NFR24 and RFM69. Behavior is sometimes strange. No NACKs for weeks and then a really high number of NACKs for a few days. Setup not changed. I have no idea why... Same for indoor and outdoor sensors.@karlheinz2000 said in Handling NACKs:
I use NFR24 and RFM69. Behavior is sometimes strange. No NACKs for weeks and then a really high number of NACKs for a few days. Setup not changed. I have no idea why... Same for indoor and outdoor sensors.
I've had similar effects and could relate this back to the gateway. I'm using an MQTT gateway and if that has Wifi connection issues, it is trying to reconnect to the network in a loop. During these retries it can't handle the NRF communication, if there are more messages than fit in the buffer.
After solving these Wifi issues (updated the ESP32 core) and using the latest Mysensors release, things work much better. -
@mfalkvidd - do you have a pointer to where I can start, bear in mind Im a very bad coder so I need somewhere to start following the logic.
Controller: Proxmox VM - Home Assistant
MySensors GW: Arduino Uno - W5100 Ethernet, Gw Shield Nrf24l01+ 2,4Ghz
MySensors GW: Arduino Uno - Gw Shield RFM69, 433mhz
RFLink GW - Arduino Mega + RFLink Shield, 433mhz -
@mfalkvidd - do you have a pointer to where I can start, bear in mind Im a very bad coder so I need somewhere to start following the logic.
@sundberg84 seems like it isn't very well documented, but https://forum.mysensors.org/topic/7181/what-do-the-error-led-flashes-mean/9?_=1582119986104 has some information.
increasing a counter for every INDICATION_ERR_TX and another counter for every INDICATION_TX could be sufficient to get a good ratio of how many successful and failed transmissions there are.
Edit: https://forum.mysensors.org/post/89230 might be better to start from
-
Something like this should work. Not sure if a power meter is the best way to present to controller, fee free to use something better.
// Enable debug prints to serial monitor
#define MY_DEBUG

// Enable and select radio type attached
#define MY_RADIO_RF24
//#define MY_RADIO_NRF5_ESB
//#define MY_RADIO_RFM69
//#define MY_RADIO_RFM95

// Enabled repeater feature for this node
#define MY_REPEATER_FEATURE

#define MY_INDICATION_HANDLER
static uint32_t txOK = 0;
static uint32_t txERR = 0;
#define REPORT_INTERVAL 300000 // Report every 5 minutes
#define CHILD_ID_TX_OK 1
#define CHILD_ID_TX_ERR 2

#include <MySensors.h>

MyMessage txOKmsg(CHILD_ID_TX_OK, V_KWH);
MyMessage txERRmsg(CHILD_ID_TX_ERR, V_KWH);

void indication(indication_t ind)
{
  switch (ind)
  {
    case INDICATION_TX:
      txOK++;
      break;
    case INDICATION_ERR_TX:
      txERR++;
      break;
  }
}

void setup()
{

}

void presentation()
{
  //Send the sensor node sketch version information to the gateway
  sendSketchInfo(F("Repeater Node"), F("1.0"));
  present(CHILD_ID_TX_OK, S_POWER);
  present(CHILD_ID_TX_ERR, S_POWER);
}

void loop()
{
  static unsigned long last_send = 0;
  if (millis() - last_send > REPORT_INTERVAL) {
    send(txOKmsg.set(txOK));
    send(txERRmsg.set(txERR));
    last_send=millis();
  }
}
The same could probably be added to any gateway sketch.
@mfalkvidd - appreciate you time here, should have taken me hours and hours!
Controller: Proxmox VM - Home Assistant
MySensors GW: Arduino Uno - W5100 Ethernet, Gw Shield Nrf24l01+ 2,4Ghz
MySensors GW: Arduino Uno - Gw Shield RFM69, 433mhz
RFLink GW - Arduino Mega + RFLink Shield, 433mhz -
@mfalkvidd - appreciate you time here, should have taken me hours and hours!
-
@sundberg84 you're welcome. I'm trying to add the feature to one of my gateways now (I don't have any repeaters).
-
@mfalkvidd I won't sleep tonight now! - Can't wait to see how it works out in the 'real world' for you....
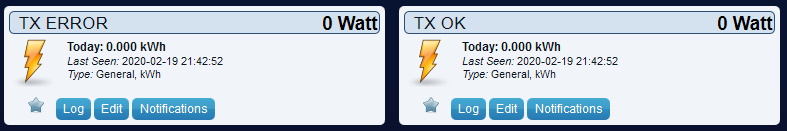
@skywatch so far it is not showing anything interesting. On the other hand, I don't think my GW will transmit anything (no nodes request anything from the controller). This is what it looks like in Domoticz:
I'll let it run overnight, will post an update tomorrow.
-
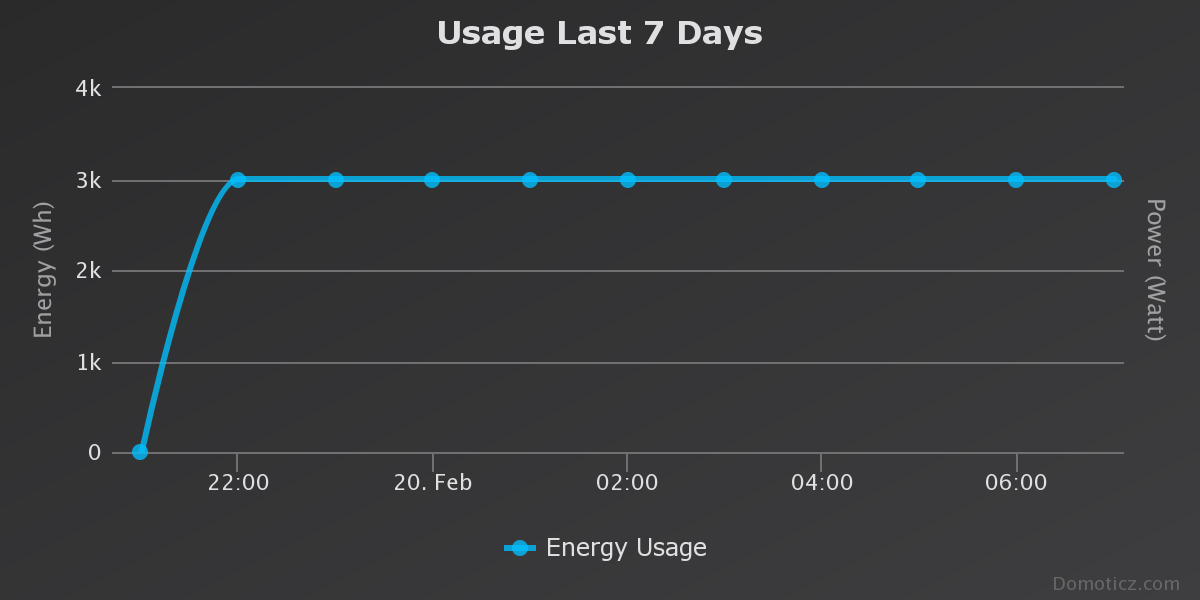
As expected, there have been no errors recorded. The number of TX OK per hour is constant.
Domoticz log file shows that the gateway reports every 5 minutes.
Maybe the gateway should look at INDICATION_GW_TX.
@mfalkvidd - INDICATION_GW_TX sounds like a good plan. This is a great tool I think for the future to evaluate and debug your network. I used S_CUSTOM and a utility meter (hourly) in HA to get the values.
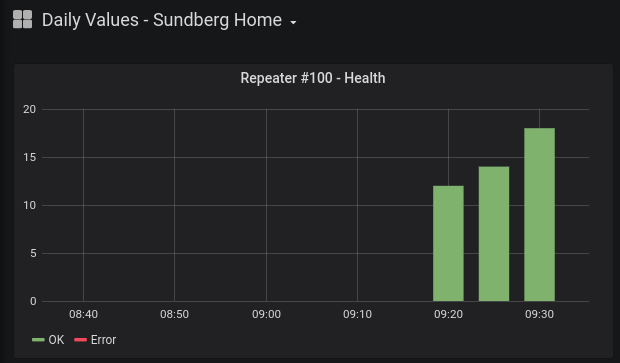
Just started up, first values in - will report back when I have more data:
No errors so far :)Just so I understand: case INDICATION_ERR_TX: means NACK ?
Controller: Proxmox VM - Home Assistant
MySensors GW: Arduino Uno - W5100 Ethernet, Gw Shield Nrf24l01+ 2,4Ghz
MySensors GW: Arduino Uno - Gw Shield RFM69, 433mhz
RFLink GW - Arduino Mega + RFLink Shield, 433mhz -
@mfalkvidd - INDICATION_GW_TX sounds like a good plan. This is a great tool I think for the future to evaluate and debug your network. I used S_CUSTOM and a utility meter (hourly) in HA to get the values.
Just started up, first values in - will report back when I have more data:
No errors so far :)Just so I understand: case INDICATION_ERR_TX: means NACK ?
@sundberg84 I think so.
https://github.com/mysensors/MySensors/blob/79d7977cff47555d7bc812036caa6159df9cc8c7/core/MyTransport.cpp#L560 (I've cut out some code for brevity)
const bool result = transportSendWrite(route, message); #if !defined(MY_GATEWAY_FEATURE) // update counter if (route == _transportConfig.parentNodeId) { if (!result) { setIndication(INDICATION_ERR_TX); _transportSM.failedUplinkTransmissions++; } else { _transportSM.failedUplinkTransmissions = 0u; } } #else if(!result) { setIndication(INDICATION_ERR_TX); } #endif/** * @brief Send message to recipient * @param to Recipient of message * @param message * @return true if message sent successfully */I guess we could use _transportSM.failedUplinkTransmissions instead of using our own counter.
-
@mfalkvidd said in Handling NACKs:
I guess we could use _transportSM.failedUplinkTransmissions instead of using our own counter.
That one is reset when a message is sent successfully, and we want to know the total number of failed msgs right?
-
@mfalkvidd said in Handling NACKs:
I guess we could use _transportSM.failedUplinkTransmissions instead of using our own counter.
That one is reset when a message is sent successfully, and we want to know the total number of failed msgs right?
-
Something strange happened last hour:
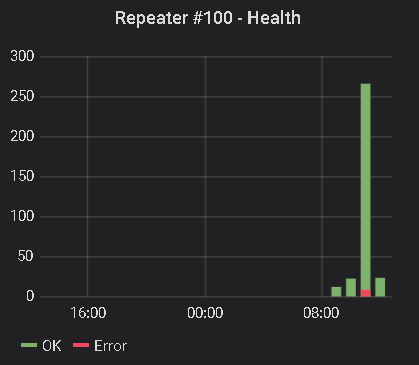
But atleast now I know something is up.
Controller: Proxmox VM - Home Assistant
MySensors GW: Arduino Uno - W5100 Ethernet, Gw Shield Nrf24l01+ 2,4Ghz
MySensors GW: Arduino Uno - Gw Shield RFM69, 433mhz
RFLink GW - Arduino Mega + RFLink Shield, 433mhz -
Something strange happened last hour:
But atleast now I know something is up.
@sundberg84 said in Handling NACKs:
Something strange happened last hour:
@sundberg84 - OMG, I have sat through whole flims with less suspense than this thread! ......
-
Something strange happened last hour:
But atleast now I know something is up.
-
@sundberg84 that's a very nice visual representation. Could you share how you set that up in HA?
@mfalkvidd - its accually Grafana and Influx database. So HA sends values to Influx which are visually presented in Grafana. Im sure you can do this from Domoticz as well... there are some limitations in Influx db so I might change to another database in the future which suits me better.
Controller: Proxmox VM - Home Assistant
MySensors GW: Arduino Uno - W5100 Ethernet, Gw Shield Nrf24l01+ 2,4Ghz
MySensors GW: Arduino Uno - Gw Shield RFM69, 433mhz
RFLink GW - Arduino Mega + RFLink Shield, 433mhz -
@mfalkvidd - its accually Grafana and Influx database. So HA sends values to Influx which are visually presented in Grafana. Im sure you can do this from Domoticz as well... there are some limitations in Influx db so I might change to another database in the future which suits me better.
@sundberg84 sorry for going off topic, but what limitations have you experienced?
I've been thinking about using something better than Domoticz for a long time. Maybe Grafana is the way to go.