Handling NACKs
-
@mfalkvidd I won't sleep tonight now! - Can't wait to see how it works out in the 'real world' for you....
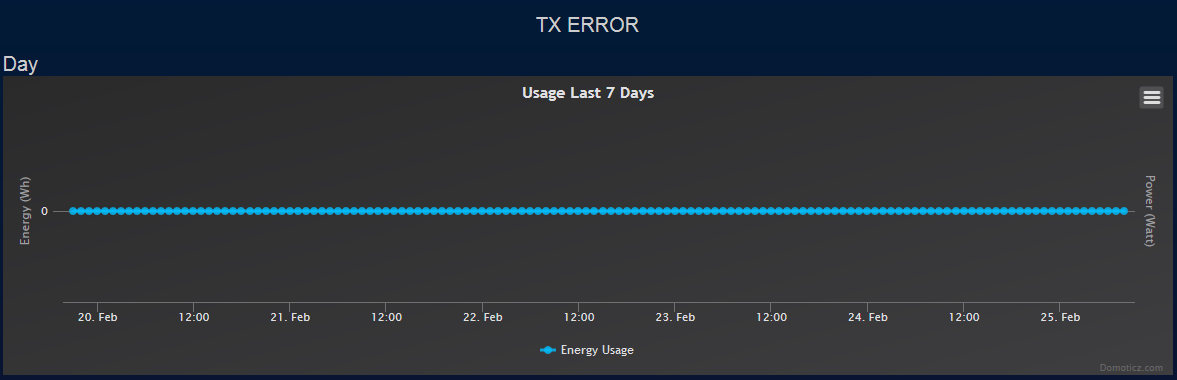
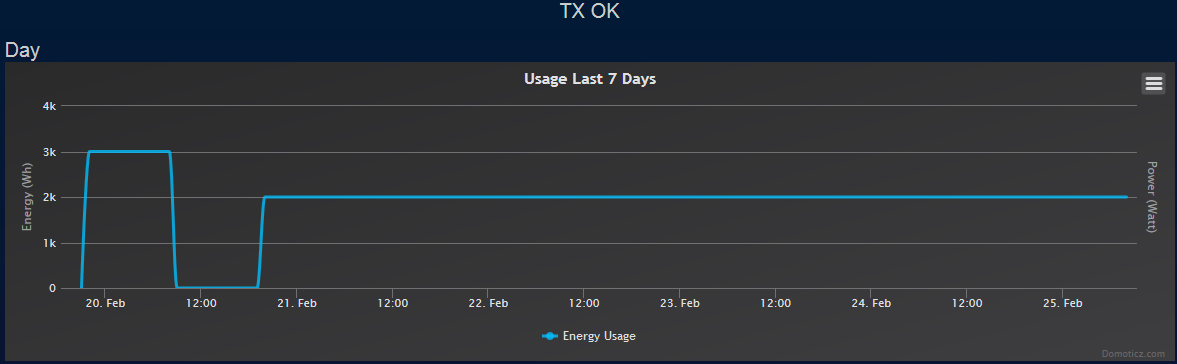
@skywatch so far it is not showing anything interesting. On the other hand, I don't think my GW will transmit anything (no nodes request anything from the controller). This is what it looks like in Domoticz:
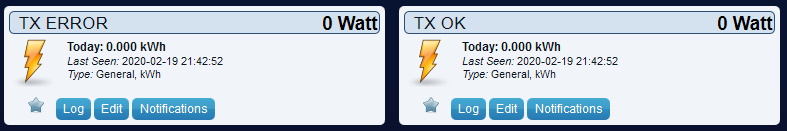
I'll let it run overnight, will post an update tomorrow.
-
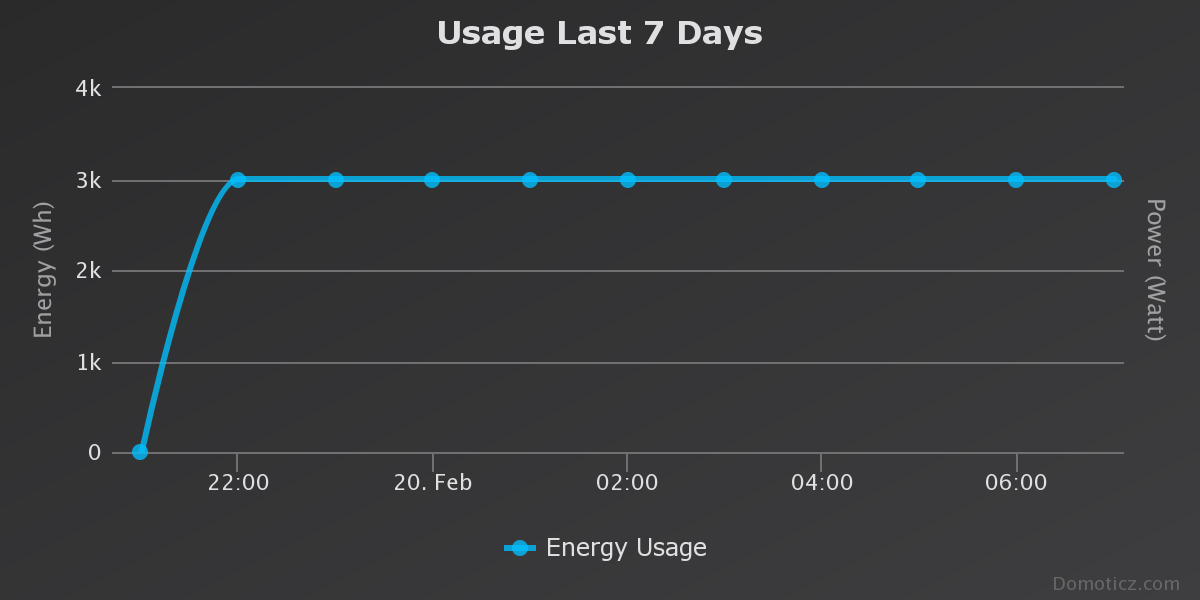
As expected, there have been no errors recorded. The number of TX OK per hour is constant.
Domoticz log file shows that the gateway reports every 5 minutes.
Maybe the gateway should look at INDICATION_GW_TX.
@mfalkvidd - INDICATION_GW_TX sounds like a good plan. This is a great tool I think for the future to evaluate and debug your network. I used S_CUSTOM and a utility meter (hourly) in HA to get the values.
Just started up, first values in - will report back when I have more data:
No errors so far :)Just so I understand: case INDICATION_ERR_TX: means NACK ?
Controller: Proxmox VM - Home Assistant
MySensors GW: Arduino Uno - W5100 Ethernet, Gw Shield Nrf24l01+ 2,4Ghz
MySensors GW: Arduino Uno - Gw Shield RFM69, 433mhz
RFLink GW - Arduino Mega + RFLink Shield, 433mhz -
@mfalkvidd - INDICATION_GW_TX sounds like a good plan. This is a great tool I think for the future to evaluate and debug your network. I used S_CUSTOM and a utility meter (hourly) in HA to get the values.
Just started up, first values in - will report back when I have more data:
No errors so far :)Just so I understand: case INDICATION_ERR_TX: means NACK ?
@sundberg84 I think so.
https://github.com/mysensors/MySensors/blob/79d7977cff47555d7bc812036caa6159df9cc8c7/core/MyTransport.cpp#L560 (I've cut out some code for brevity)
const bool result = transportSendWrite(route, message); #if !defined(MY_GATEWAY_FEATURE) // update counter if (route == _transportConfig.parentNodeId) { if (!result) { setIndication(INDICATION_ERR_TX); _transportSM.failedUplinkTransmissions++; } else { _transportSM.failedUplinkTransmissions = 0u; } } #else if(!result) { setIndication(INDICATION_ERR_TX); } #endif/** * @brief Send message to recipient * @param to Recipient of message * @param message * @return true if message sent successfully */I guess we could use _transportSM.failedUplinkTransmissions instead of using our own counter.
-
@mfalkvidd said in Handling NACKs:
I guess we could use _transportSM.failedUplinkTransmissions instead of using our own counter.
That one is reset when a message is sent successfully, and we want to know the total number of failed msgs right?
-
@mfalkvidd said in Handling NACKs:
I guess we could use _transportSM.failedUplinkTransmissions instead of using our own counter.
That one is reset when a message is sent successfully, and we want to know the total number of failed msgs right?
-
Something strange happened last hour:
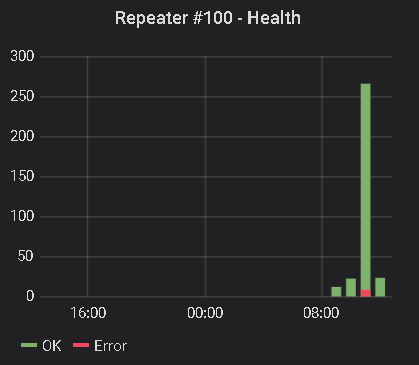
But atleast now I know something is up.
Controller: Proxmox VM - Home Assistant
MySensors GW: Arduino Uno - W5100 Ethernet, Gw Shield Nrf24l01+ 2,4Ghz
MySensors GW: Arduino Uno - Gw Shield RFM69, 433mhz
RFLink GW - Arduino Mega + RFLink Shield, 433mhz -
Something strange happened last hour:
But atleast now I know something is up.
@sundberg84 said in Handling NACKs:
Something strange happened last hour:
@sundberg84 - OMG, I have sat through whole flims with less suspense than this thread! ......
-
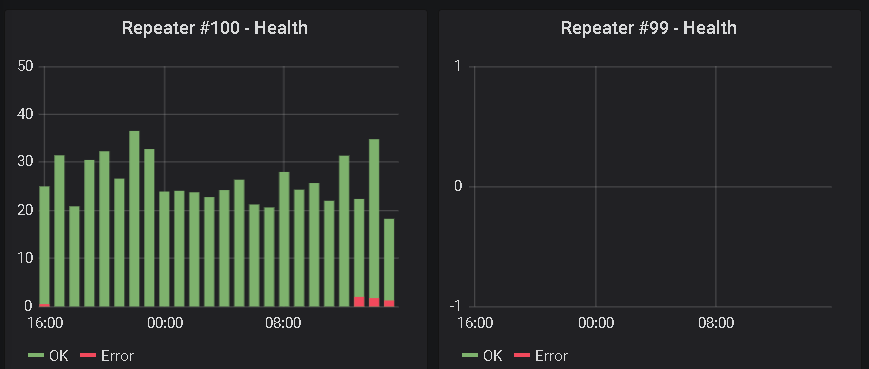
Something strange happened last hour:
But atleast now I know something is up.
-
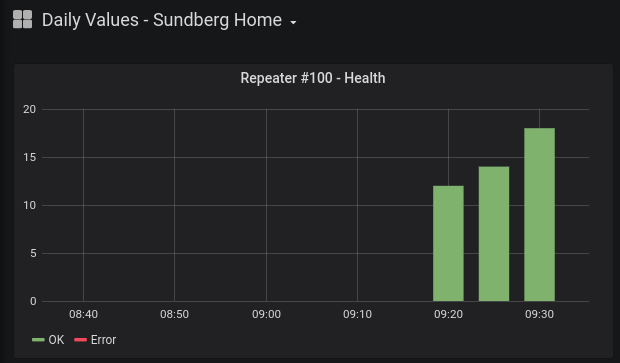
@sundberg84 that's a very nice visual representation. Could you share how you set that up in HA?
@mfalkvidd - its accually Grafana and Influx database. So HA sends values to Influx which are visually presented in Grafana. Im sure you can do this from Domoticz as well... there are some limitations in Influx db so I might change to another database in the future which suits me better.
Controller: Proxmox VM - Home Assistant
MySensors GW: Arduino Uno - W5100 Ethernet, Gw Shield Nrf24l01+ 2,4Ghz
MySensors GW: Arduino Uno - Gw Shield RFM69, 433mhz
RFLink GW - Arduino Mega + RFLink Shield, 433mhz -
@mfalkvidd - its accually Grafana and Influx database. So HA sends values to Influx which are visually presented in Grafana. Im sure you can do this from Domoticz as well... there are some limitations in Influx db so I might change to another database in the future which suits me better.
@sundberg84 sorry for going off topic, but what limitations have you experienced?
I've been thinking about using something better than Domoticz for a long time. Maybe Grafana is the way to go.
-
@sundberg84 sorry for going off topic, but what limitations have you experienced?
I've been thinking about using something better than Domoticz for a long time. Maybe Grafana is the way to go.
@mfalkvidd Domoticz is a full-blown home automation system, isn't it? Grafana is just a monitoring dashboard that pulls data from a time-series database (like InfluxDB) and generates fancy graphs. It can't automate and control things or send commands other than alarms (eg. if a value exceeds a threshold, or no new data came in since x minutes, send an email).
One of InfluxDBs limitations is that you can't use (or only some basic) math operations on db queries, which may limit what you can graph in Grafana. Also, changing data types of existing fields in measurements is also not possible, which is annoying, because Grafana treats values differently based on their data type. @sundberg84 can probably name more limitations. I'd love to switch to Carbon / Graphite for data collection and storage... if only it wouldn't take time to read up, setup and migrate all the data. :tired_face:
By the way - great idea to use the indication handler to log radio reliability! :+1: Definitely going to implement this on my
gatewaysrepeaters when I find the time. -
@sundberg84 sorry for going off topic, but what limitations have you experienced?
I've been thinking about using something better than Domoticz for a long time. Maybe Grafana is the way to go.
@mfalkvidd - @BearWithBeard said it. The limitations are mostly math related. For example, you cant show a graph with current and last years values (timeshift) on the same graph due to that limitation in InfluxDB. I want to compare power usage this day to same day last year - not possible. Im looking to change to Graphite as well instead of Influx.
Moving from Domoticz to HA was a great move for me, but not as i thought. Im using HA more or less just as an umbrella. I would say im using only the OS Hass.IO and not using Home Assistant that much. Whats good in Home Assistant is that its quite easy to integrate different protocolls like MySensors or whatever you use. But after that I dont use Home Assistant but the great possibilities to have add-ons on Hass.IO. I use Node Red for all my automations (Extremly easy compared to code!), Influx + Grafana for visual, motionEyeOs for camera secutiry and more... all you have to do is install the addon from the "store" and you are more or less ready to go. These addons im sure you can install with domoticz as well if you like the integrations with the different protocolls there.
i think we have handeled the NACK questions so no worries for me if we go off topic, but if you rather like send me a dm.
-
I just love this idea. Implemented the code on my second now, one to go.
Controller: Proxmox VM - Home Assistant
MySensors GW: Arduino Uno - W5100 Ethernet, Gw Shield Nrf24l01+ 2,4Ghz
MySensors GW: Arduino Uno - Gw Shield RFM69, 433mhz
RFLink GW - Arduino Mega + RFLink Shield, 433mhz -
I just love this idea. Implemented the code on my second now, one to go.
@sundberg84 very nice. I'm happy we were able to implement it with so little effort. What does your graph look like now?
Mine is very boring, as I suspected. Don't have any outgoing traffic from my GW. Will have to add it to my nodes to get any useful data.
-
@sundberg84 very nice. I'm happy we were able to implement it with so little effort. What does your graph look like now?
Mine is very boring, as I suspected. Don't have any outgoing traffic from my GW. Will have to add it to my nodes to get any useful data.
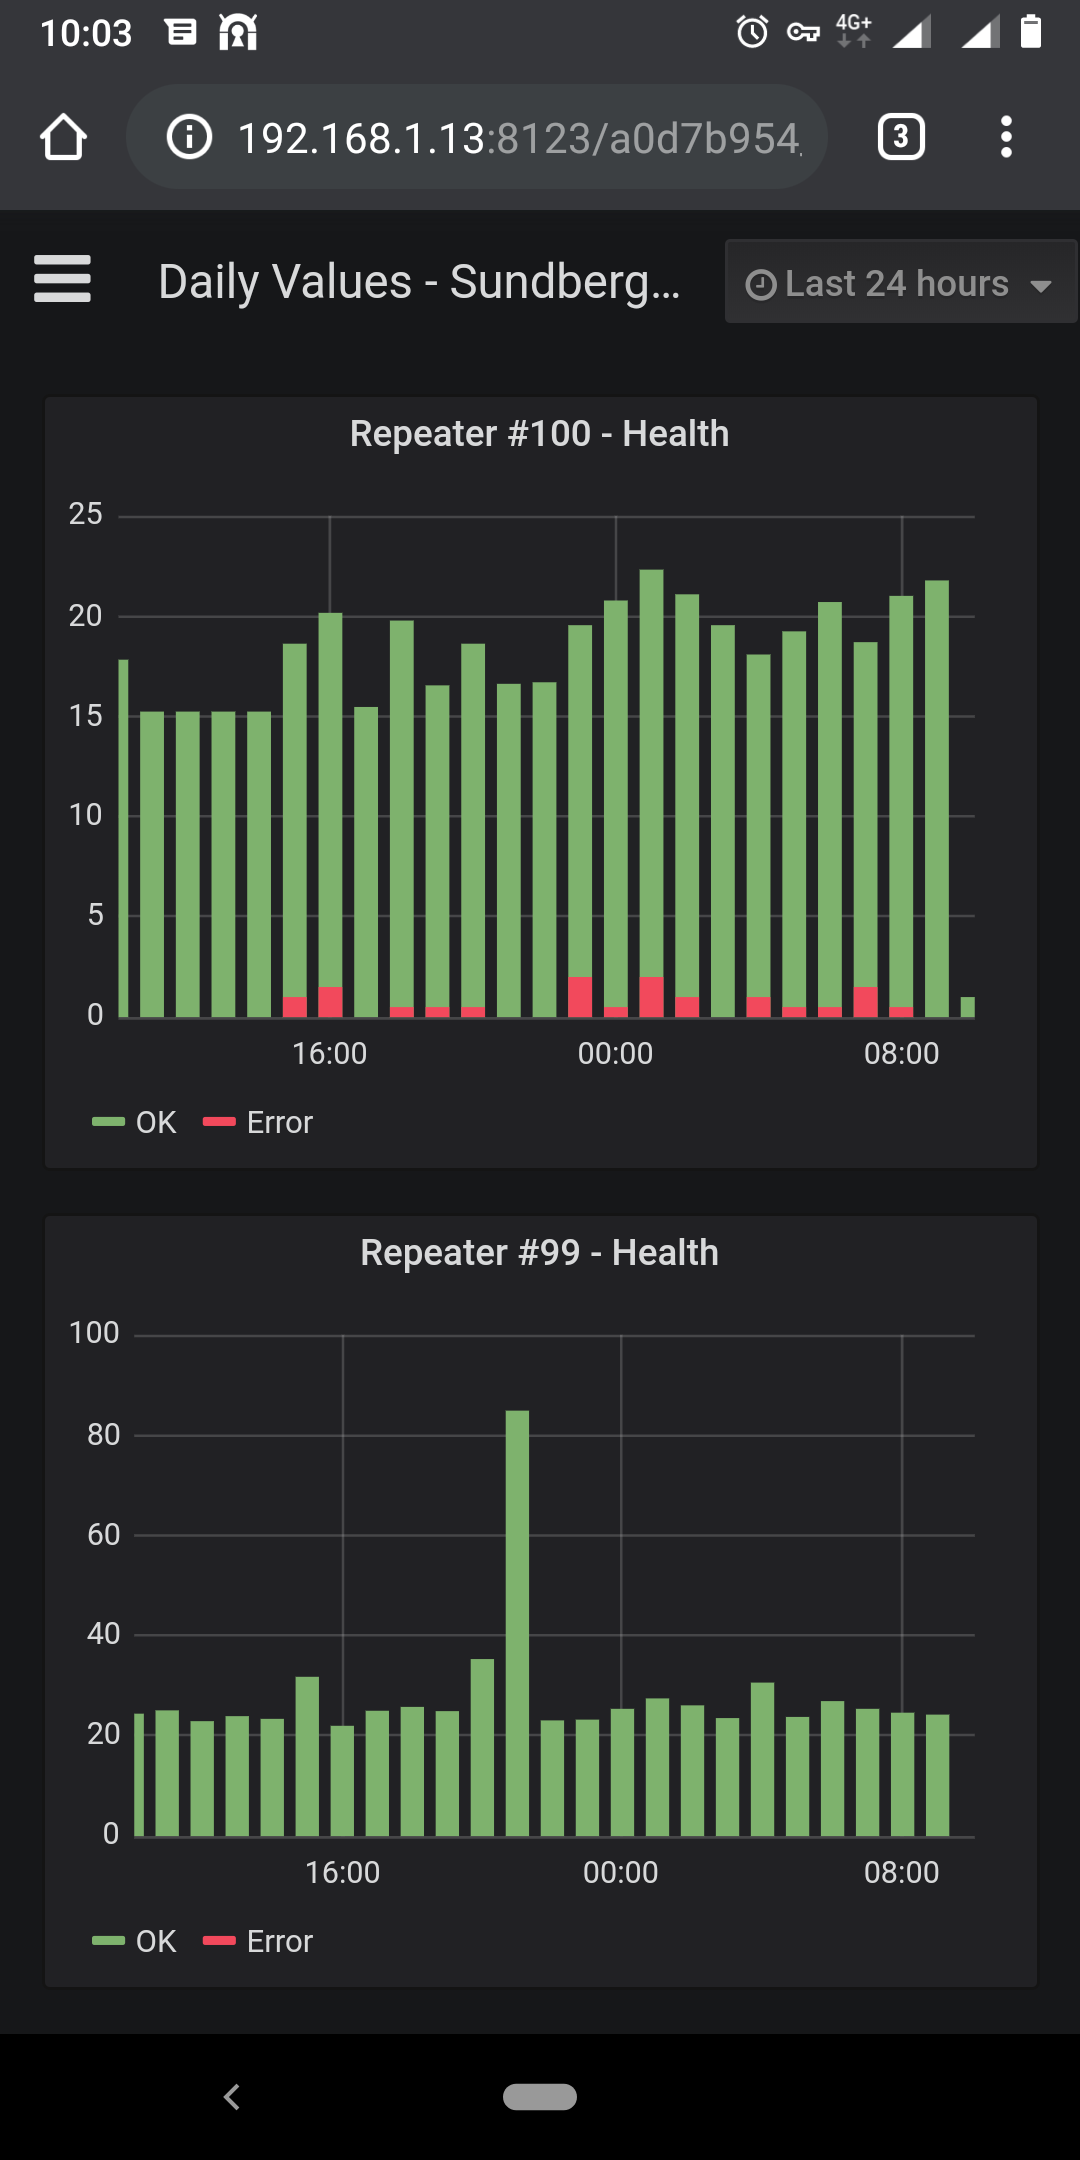
@mfalkvidd i didnt fins time yet to implement more. But very good for two repeaters.
-
Very cool stuff.
@mfalkvidd Would it be possible to create the functionality, but to measure the successrate of outgoing messages from the gateway node?
For example, I'l love to be able to see how often the controller/gateway tries to toggle a distant node, but fails.
-
Very cool stuff.
@mfalkvidd Would it be possible to create the functionality, but to measure the successrate of outgoing messages from the gateway node?
For example, I'l love to be able to see how often the controller/gateway tries to toggle a distant node, but fails.
-
Ah, now I see. Thanks!
-
@mfalkvidd i didnt fins time yet to implement more. But very good for two repeaters.
@sundberg84 If I get it correct you implemented in your repeater sketch the use of the MySensors indication handler?
void indication(indication_t ind)
{
  switch (ind)
  {
    case INDICATION_TX:
      txOK++;
      break;
    case INDICATION_ERR_TX:
      txERR++;
      break;
  }
}
txOk and txErr are always incremented in the sketch and send to the gateway.
Yet I see in your graphs a hourly count? Graphs from Grafana?
Can you explain how you did this?
Hello! It looks like you're interested in this conversation, but you don't have an account yet.
Getting fed up of having to scroll through the same posts each visit? When you register for an account, you'll always come back to exactly where you were before, and choose to be notified of new replies (either via email, or push notification). You'll also be able to save bookmarks and upvote posts to show your appreciation to other community members.
With your input, this post could be even better 💗
Register Login