MySensors Network at a High School Farm
-
I have been creating a sensor network at a local high school and the mysensors project is basically what makes it possible. I just launched a website on amazon documenting some of what is deployed with live graphs.
http://growing.education/index.php/farm-monitoring-and-automation/garinger-sensor-network/
At this point we are mainly just monitoring and collecting data, so my controller is a very simple node-red installation that saves data locally and transmits data via MQTT to mosquitto runing on an Amazon EC2 instance. Another installation of node-red again saves data to InfluxDB and Grafana displays the data very nicely.
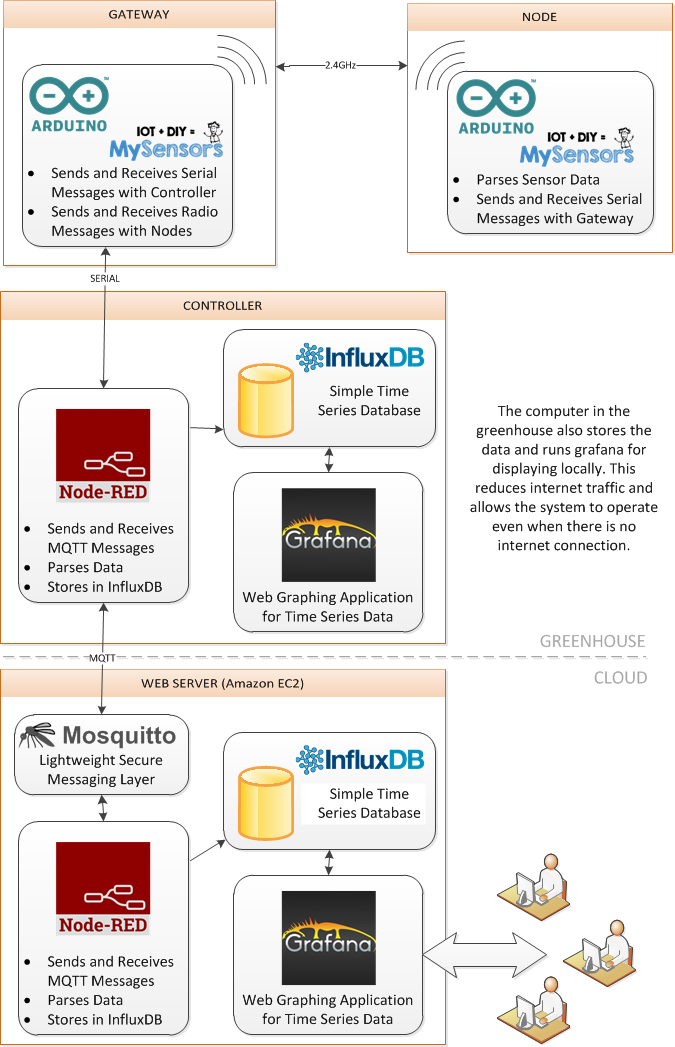
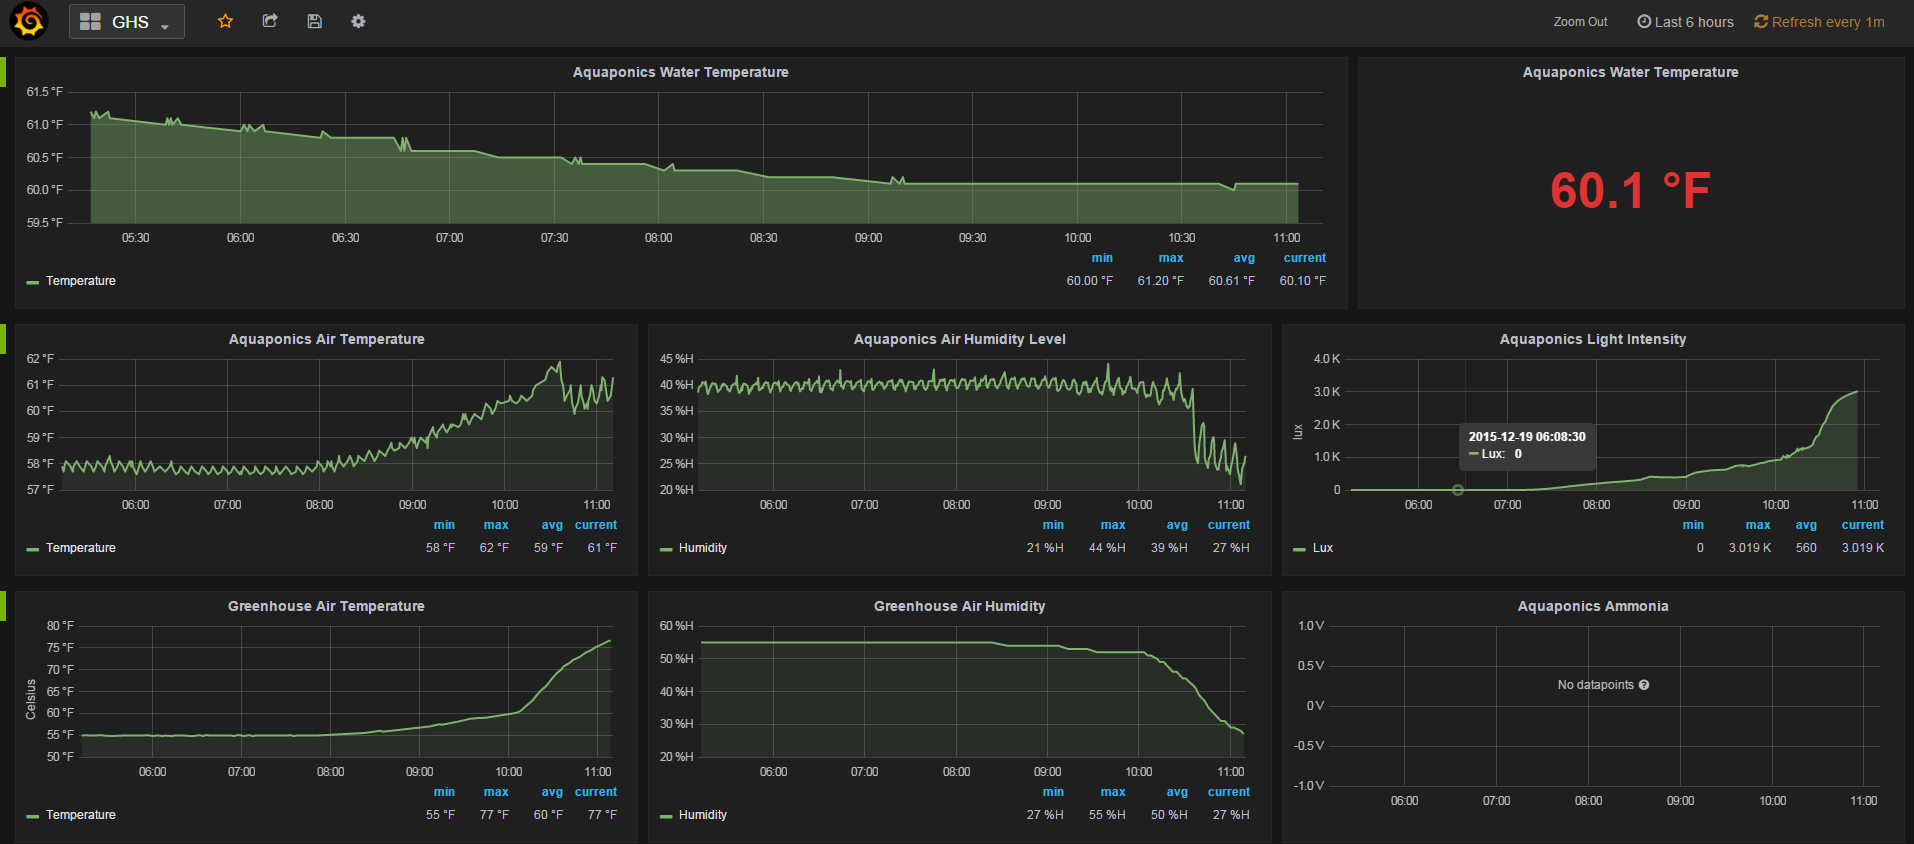
We have three active nodes. One sensebender node running off battery and another solar powered node. A sample of the graphing is below. Check it out. The site is new so I suspect there are many typos and broken links. Thanks again to this community for helping me.
-
Wow! What a great project. It's on the top of my list now. Thanks!!
-
@bpair Your setup is comparable to the one I'm running at home. I only have MQTT inbetween the MySensors network and Node-RED, and only one Node-RED instance which directly posts to InfluxDB, running locally.
Especially Grafana is simply awesome and has been the only graphing tool capable of serving all my needs.
Thanks for sharing! -
@bpair Your setup is comparable to the one I'm running at home. I only have MQTT inbetween the MySensors network and Node-RED, and only one Node-RED instance which directly posts to InfluxDB, running locally.
Especially Grafana is simply awesome and has been the only graphing tool capable of serving all my needs.
Thanks for sharing!@Yveaux Yeah Grafana has been great. I would have something similar to your setup but the greenhouse only has a cell phone hotspot so I wanted to get the data out to the cloud with as little traffic as possible. Then display all the graphs from there (grafana on Amazon)
-
@Yveaux what controller do you use?
I currently have domoticz and I'm wondering about getting it somehow to system. -
@Yveaux Yeah Grafana has been great. I would have something similar to your setup but the greenhouse only has a cell phone hotspot so I wanted to get the data out to the cloud with as little traffic as possible. Then display all the graphs from there (grafana on Amazon)
-
:+1:
@bpair What gateway-sketch (standard serial?) do you use with which version of mysensors?My setup is quite similar (influx, node-red, grafana) but no cloud deployment. Most sensors are based on mysensors, but there are others (homematic with homegear and netatmo).
-
@bpair it seems overkill to also store the data and run Grafana locally, but I can imagine this works for you.
@Yveaux The install in the greenhouse is basically because the internet connection is costly and not reliable. I have an old linux computer in teh greenhouse for the following reasons:
- To save the date even if there is no internet
- To display a nice dashboard on the computer in the greenhouse (looks impressive)
- To allow students to look at the graphs locally without internet
-
:+1:
@bpair What gateway-sketch (standard serial?) do you use with which version of mysensors?My setup is quite similar (influx, node-red, grafana) but no cloud deployment. Most sensors are based on mysensors, but there are others (homematic with homegear and netatmo).
@FotoFieber Just the standard serial gateway. There is a nice node-red node for parsing mysensors serial data. I then have some basic code that recognizes the specific data, e.g. node 9 child 10 is the aquaponics water temperature, so that I can store more information in influxd to mak ethe graphs better.
I also have node-red respond to the metric/imperial question. That is basically it.
Hello! It looks like you're interested in this conversation, but you don't have an account yet.
Getting fed up of having to scroll through the same posts each visit? When you register for an account, you'll always come back to exactly where you were before, and choose to be notified of new replies (either via email, or push notification). You'll also be able to save bookmarks and upvote posts to show your appreciation to other community members.
With your input, this post could be even better 💗
Register Login