Event Drops: Visualizing message frequencies with d3.js
-
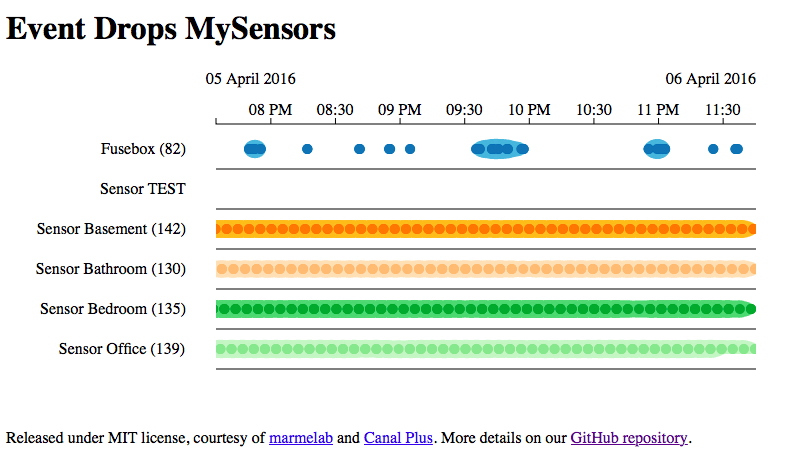
For the fine tuning of my MySensors network (e.g. for placing the sensor nodes), I was so far checking the incoming messages via the log of my controller. But since this becomes a bit tedious over time, I was looking for a simple way to visualize the frequency of these messages. To be precise, I do not mean to visualize the content of the incoming messages but only that the controller received a message from a node. The result looks like this:

The graph is made with Event Drops, which makes use of the d3.js library. I basically just installed the demo in an apache and modified it such that it gets the data about my MySensor nodes. The data is stored in two tables, sensors and pings, in a MySQL-database:
sensors
---------
id: INT
name: CHAR(25)
pings --------- sensor: INT date: DATETIMEThe table sensors holds a row for each sensor that I want to be included in the graph, in which id is equal to the node id. In the table pings, my controller inserts a new entry with the node id in the field sensor and the current time in the field date each time it receives a message from a node.
A php-script that replaces the index.html of the Event Drops demo, queries the data and builds a JS-array according to this definition:
<?php
$username = "db_user";
$password = "passwd";
$host = "localhost";
$dbname="mysensors_db";

// Create connection
$conn = new mysqli($host, $username, $password, $dbname);
// Check connection
if ($conn->connect_error) {
    die("Connection failed: " . $conn->connect_error);
}

$sql = "SELECT id, name FROM sensors";
$result = $conn->query($sql);

$outdata =  "var data = [";
$firstA =  True;
if ($result->num_rows > 0) {
    // output data of each row
    while($row = $result->fetch_assoc()) {
        if (! $firstA) {$outdata = $outdata .  ", "; }
        $firstA =  False;
        $outdata = $outdata . "{ name : \"" . $row["name"]. "\" , dates : [ "   ;
        $sqlPings = "SELECT date FROM pings WHERE sensor=".$row["id"];
        $resultPings = $conn->query($sqlPings);
        $firstB =  True;
        while($rowPings = $resultPings->fetch_assoc()) {
                if (! $firstB) {$outdata = $outdata . ", "; }
                $outdata = $outdata . "new Date('". str_replace("-","/",$rowPings["date"]) ."')";
                $firstB = false;
        }
        $outdata = $outdata . "] }";
    }
} else {
    echo "0 results";
}
$outdata = $outdata . "]";

mysqli_close($conn);
?>

<!DOCTYPE html>
<meta charset="utf-8">
<html>
    <head>
        <title>Event Drops Demo</title>
        <link rel="stylesheet" href="../eventdrops/eventDrops.css" />
    </head>
    <body>
        <h1>Event Drops MySensors</h1>
        <script src="../d3/d3.js"></script>
        <script src="../eventdrops/eventDrops.js"></script>
        <script>
                <?php
                echo $outdata;
                ?>
        </script>
        <script src="./demo.js"></script>
        <p>
            Released under MIT license, courtesy of <a href="http://marmelab.com/">marmelab</a>
            and <a href="https://github.com/canalplus">Canal Plus</a>. More details on our
            <a href="https://github.com/marmelab/EventDrops">GitHub repository</a>.
        </p>
    </body>
</html>
In the demo.js I just removed all declarations to create random data and changed the interval from 6 months to half a day:
/*eslint-disable */

var endTime = Date.now();
var day =  24 * 60 * 60 * 1000;
var startTime = endTime - 0.5 * day;


var color = d3.scale.category20();

// create chart function
var eventDropsChart = d3.chart.eventDrops()
    .eventLineColor(function (datum, index) {
        return color(index);
    })
    .start(new Date(startTime))
    .end(new Date(endTime));

console.info(data);
// bind data with DOM
var element = d3.select("body").datum(data);

// draw the chart
eventDropsChart(element);
I am posting this in the hope that maybe someone finds it useful and of course to hear your comments and suggestions.